
FIGURE 8.
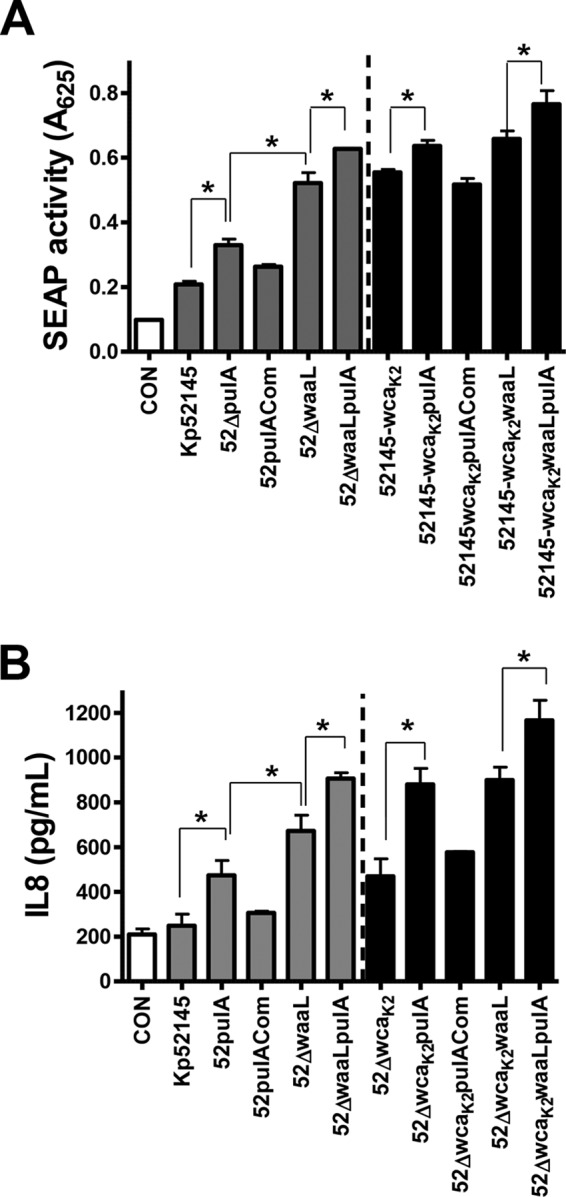
Relative contribution of CPS, LPS O-polysaccharide, and PulA T2SS to K. pneumoniae-triggered attenuation of NF-κB activation. A, SEAP levels released by A549 cells left untreated (control (CON), white bar) or infected with the indicated strains (n = 3). B, ELISA of IL-8 released by A549 cells left untreated (control, white bar) or infected for 12 h with the indicated strains (n = 3). Scale bars represent mean ± S.E. CPS-expressing strains, gray bars; CPS negative strains, black bars. *, p < 0.05 (for the indicated comparisons, one-tailed t test).