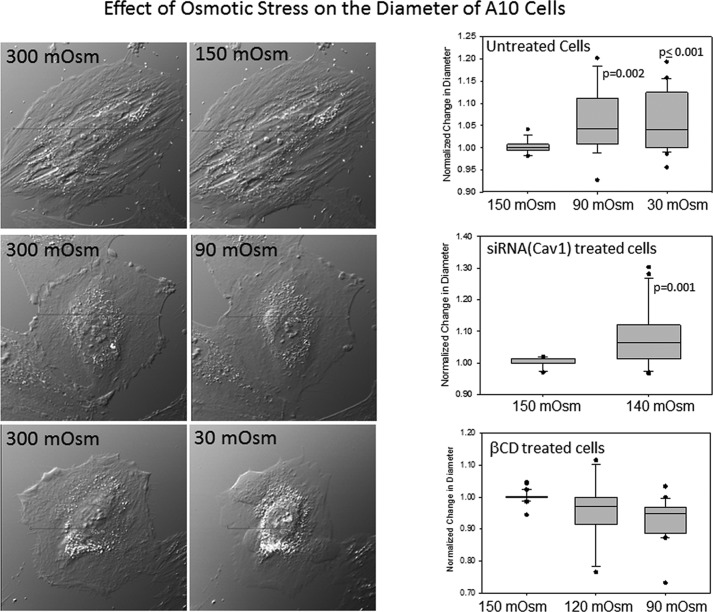
FIGURE 1.
Changes in cell volume with dilution. Images of cells placed in Leibovitz's medium (L-15) and then diluted with deionized water (1:9 dilution for 30 mosm, 1:2.3 dilution for 90 mosm, and 1:1 for 150 mosm hypo-osmotic shock) (left) are shown. Cells were viewed after 5 min at room temperature using a ×40 objective. Right, box plots showing changes in the ratio of cells at different osmotic strength divided by those under hypo-osmotic conditions where n = 15–32.

