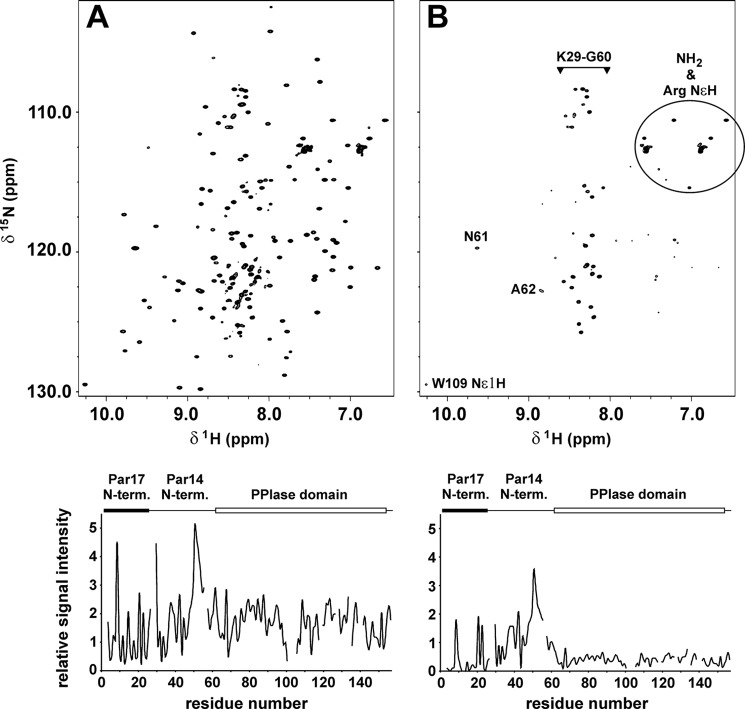
FIGURE 6.
1H,15N HSQC spectra of 0. 9 mm13C/15N-labeled Par17 collected at 18 °C and pH 6.8 in the absence of Ca2+/CaM (A) and in the presence of a 1.4-fold excess of Ca2+/CaM (B). Relative intensities of the Par17 backbone amide signals are shown in the lower panels, where the first 25 residues comprising the N-terminal extension of Par17 as well as the PPIase domain are indicated above the intensity plots by black and white boxes, respectively. In B, the side-chain NH and NH2 signals are marked accordingly; all remaining strong peaks belong to the backbone amide groups in segment Lys-29–Ala-62.

