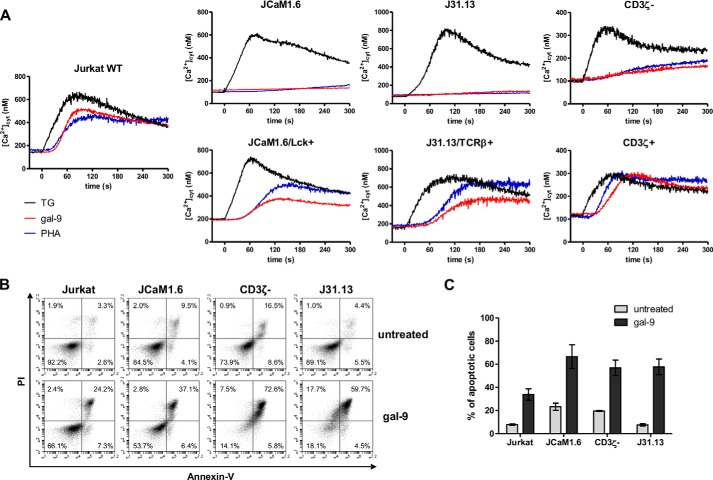
FIGURE 5.
Contribution of the TCR-CD3 complex to gal-9-induced modifications in Jurkat cells. A, variations of [Ca2+]cyt in WT Jurkat and derivative sublines under stimulation by gal-9 (30 nm), PHA (10 μg/ml), or TG (1 μm) at t = 0 s. Graphs presented here are representative of at least two similar experiments. B and C, apoptosis assay in the mutant defective sublines following 24 h of gal-9 treatment (30 nm). Flow cytometry plots (B) for annexin-V/PI staining in each cell line are representative of at least three independent experiments. Means ± S.E. of annexin-V-positive cells (C) are not statistically different between cell lines, as assessed by two-way ANOVA.

