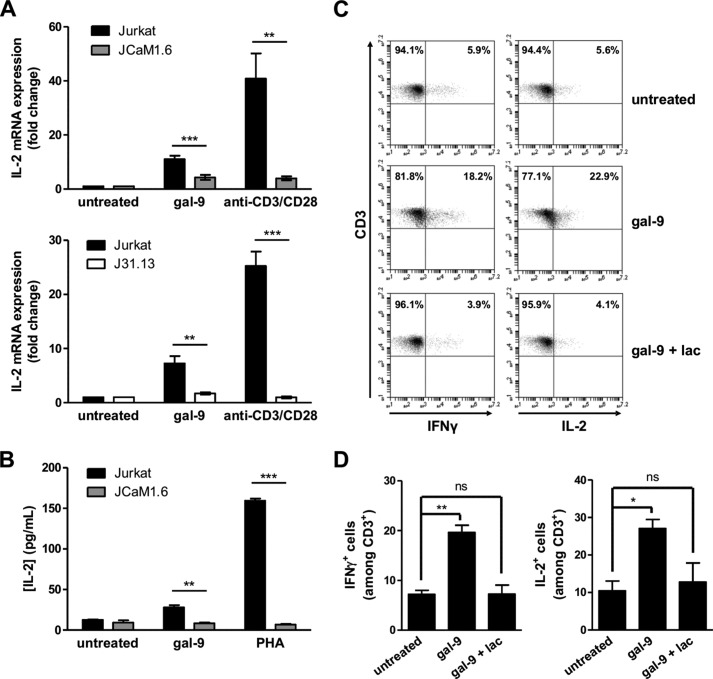
FIGURE 6.
Gal-9 induces IL-2 and IFNγ production in Jurkat and peripheral T cells. A, quantitative real time PCR determination of IL-2 mRNA expression in Jurkat, JCaM1.6 (upper histogram), or J31.13 (lower histogram) cells treated with either gal-9 (30 nm) or a combination of soluble anti-CD3 and anti-CD28 antibodies (1 μg/ml) for 3 h. Data presented here correspond to the fold change defined as the ratio of target gene mRNA with that of untreated cells (the housekeeping gene TBP being used as an internal control). Means ± S.E. of at least eight independent experiments are represented here. B, determination of IL-2 concentrations by ELISA in the culture media from Jurkat or JCaM1.6 cells treated for 24 h either with PHA (10 μg/ml) or gal-9 (30 nm). Means ± S.E. of three independent experiments are presented here. **, p < 0.01; ***, p < 0.001, two-tailed Student's t test with Welch's correction. C and D, PBMCs from healthy donors were treated with gal-9 (30 nm) or gal-9 preincubated with lactose (5 mm) for 5 days. Intracellular cytokine expression was assessed by flow cytometry immediately after PMA/ionomycin restimulation of PBMCs for 4 h as explained under “Experimental Procedures.” After gating on CD3+ T cells, IFNγ (left panel) and IL-2 (right panel) expression were analyzed (C). The percentages of CD3+ IL-2+ and CD3+ IFNγ+ cells are represented as means ± S.E. of three independent experiments with different donors (D). *, p < 0.05; **, p < 0.01, one-way ANOVA followed by Dunnett's post hoc test. ns, not significant.

