
FIGURE 2.
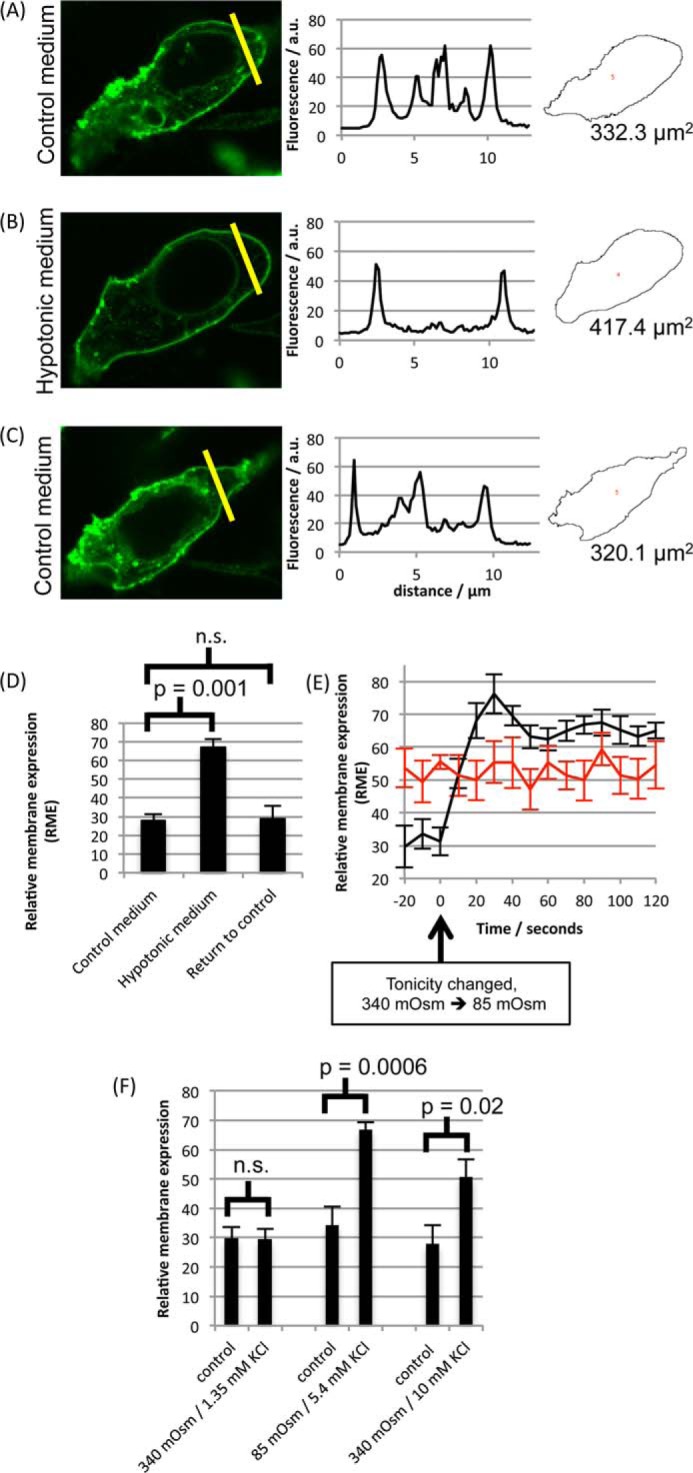
AQP4-GFP relocalization in HEK293 cells. A–C, representative fluorescence micrographs of AQP4-GFP fusion proteins in HEK293 cells following exposure to isotonic medium (340 mosm/kg of H2O) (A), a 30-s exposure to hypotonic medium (85 mosm/kg of H2O) (B), and return to isotonic extracellular environments (C), with fluorescence intensity profiles across the yellow lines and cross-sectional areas calculated using ImageJ. a. u., arbitrary units. D, mean RME in the three conditions. Three line profiles were calculated per cell, and at least three cells per image were analyzed for each experimental repeat. n = 3. p values are from paired t tests with Bonferroni's correction following analysis of variance. n.s., not significant. E, RME of AQP4-GFP fusion proteins in HEK293 cells (black curve, n = 3), measured by confocal fluorescence microscopy at a frame rate of 0.1 s−1, changed on a timescale of ∼30 s in response to reduction of extracellular tonicity from 340 mosm/kg of H2O to 85 mosm/kg of H2O, whereas membrane expression of AQP3-GFP fusion proteins did not change (red curve, n = 3). F, translocation is not due to a reduction in extracellular potassium. Extracellular potassium reduction (left pair of data points) and hypotonicity (central pair of data points) were applied independently by diluting media 4-fold with either isotonic NaCl (170 mm = 340 mosm) or 5.4 mm KCl in distilled H2O. Extracellular potassium was also increased to 10 mm in isotonic conditions (right pair of data points). All data are presented as mean ± S.E.