
FIGURE 3.
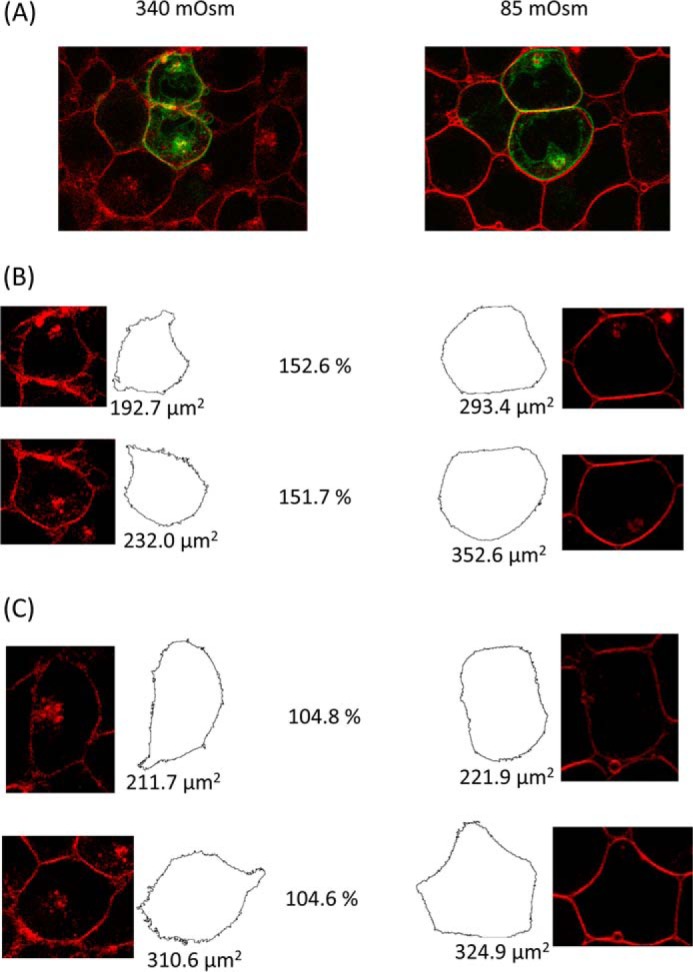
Cell swelling of AQP4-transfected cells. AQP4-GFP-transfected HEK293 cells were imaged using the GFP tag and FM4-64, a fluorescent membrane marker. A, two-color fluorescence micrograph of AQP4-GFP-transfected cells (green) loaded with FM4-64 (red), before and after reduction of extracellular osmolality from 340 mosm/kg of H2O to 85 mosm/kg of H2O. B, representative cross-sectional areas of transfected cells before and after hypotonic challenge, calculated using a particle detection algorithm. The post-hypotonic challenge area as a percentage of the pre-challenge area is shown between each pair of images. C, representative cross-sectional areas of non-transfected cells from the same image.