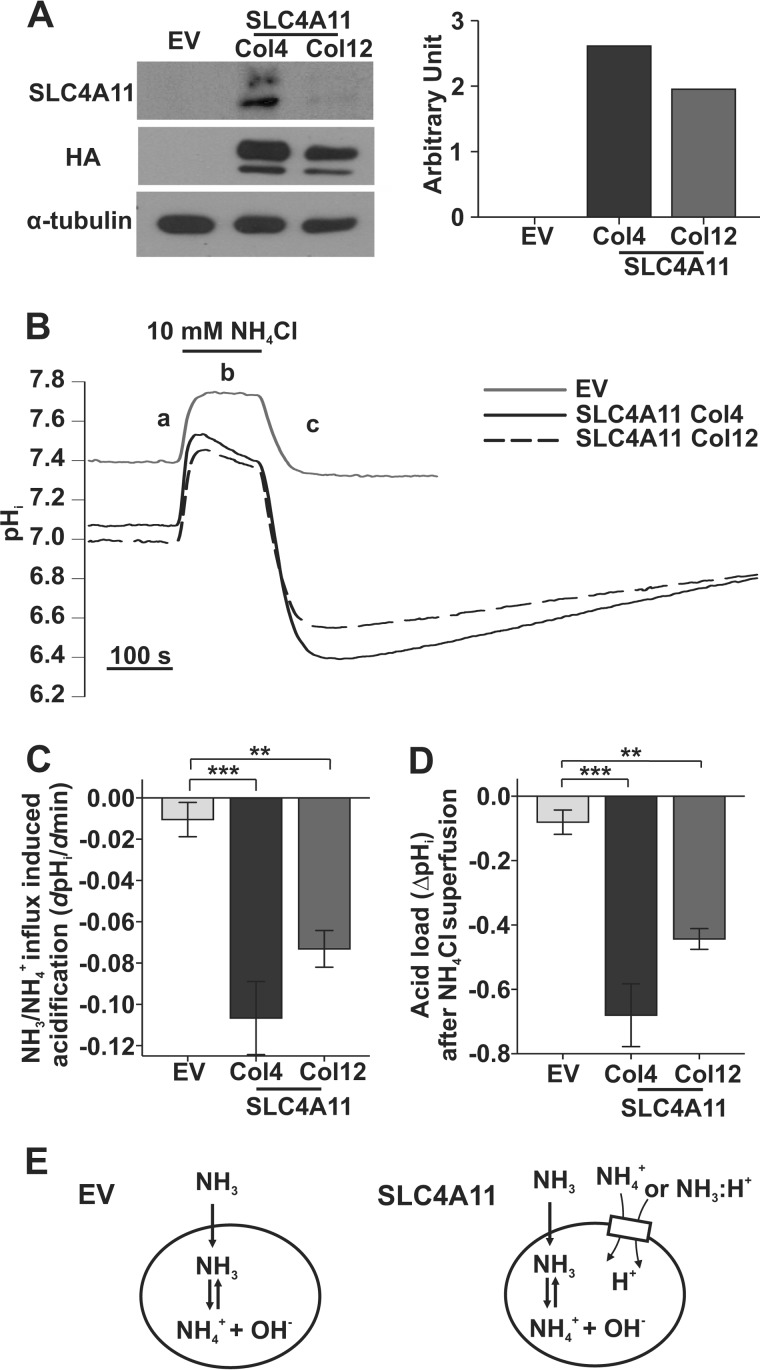
FIGURE 1.
NH4Cl superfusion induced differential intracellular acidification in SLC4A11-PS120 relative to EV-PS120 cells. A, Western blot verification of SLC4A11 expression in EV (empty vector), Col4, and Col12 using anti-SLC4A11 and anti-HA antibodies. A doublet shows glycosylated and non-glycosylated forms of SLC4A11 protein (40). The bar graph on the right shows the density quantification of HA-SLC4A11 normalized to α-tubulin. B, pHi response to 10 mm NH4Cl pulse in EV and SLC4A11 PS120 cells. Each trace is the average of n = 5 EV, n = 3 SLC4A11 Col4, and n = 3 SLC4A11 Col12, respectively. The traces show the rapid alkalinization phase (a), slow acidification phase (b), and rapid acid loading phase (c). C, phase b apparent ammonium influx (ΔpHi/Δmin) in SLC4A11 Col4 (n = 3, p = 0.001) and Col12 (n = 3, p = 0.01) is higher than in the EV control (n = 5) (one-way ANOVA with Tukey honest significant difference post hoc test, p = 0.001). D, phase c ammonium-induced peak acidification (ΔpHi) during wash is higher in SLC4A11 Col4 (n = 3, p < 0.001) and Col12 (n = 3, p = 0.004) than in the EV control (n = 5) (one-way ANOVA with Tukey honest significant difference post hoc test, p < 0.001). E, left, EV, simple NH3 diffusion equilibrates and raises pHi (phase a in Fig. 1B), but no secondary acidification occurs due to lack of NH4+ permeability (phase b). Right, SLC4A11, NH3 diffusion caused similar pHi rise as in EV (phase a); additional NH4+ (or NH3-H+) permeability from SLC4A11 adds net H+ influx and causes gradual acidification (phase b). Error bars, S.E. **, p < 0.01; ***, p < 0.001.

