
FIGURE 5.
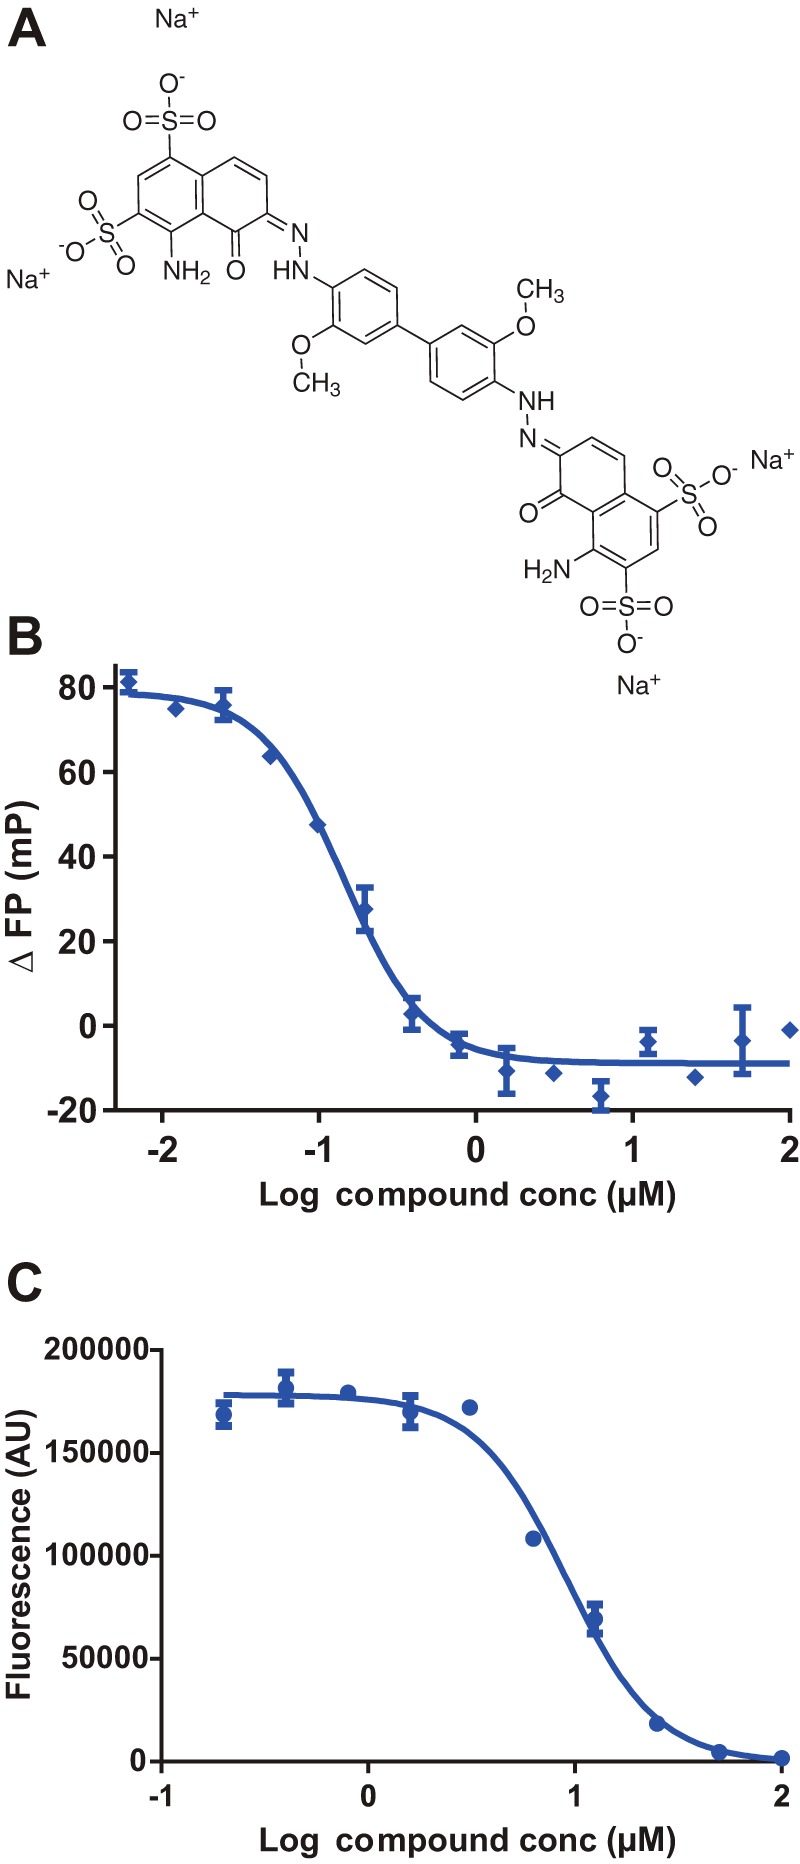
A, structure of Chicago Sky Blue 6B. B and C, dose-response curves for Chicago Sky Blue in fluorescence (B) and ELISA (C). Assays were performed in triplicate with the values expressed as the mean ± S.E. mP, millipolarization units; conc, concentration; AU, arbitrary units.