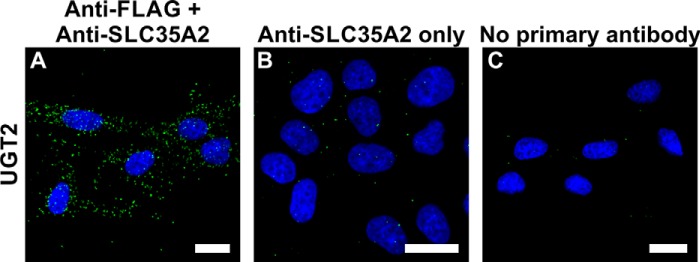
FIGURE 1.

In situ PLA controls. A, PLA analysis of UGT2 N and C terminus proximity performed in MDCK-RCAr cells. B, negative control where anti-FLAG antibody was omitted during the PLA procedure. C, negative control where both primary antibodies were omitted during the PLA procedure. Bars, 20 μm.
