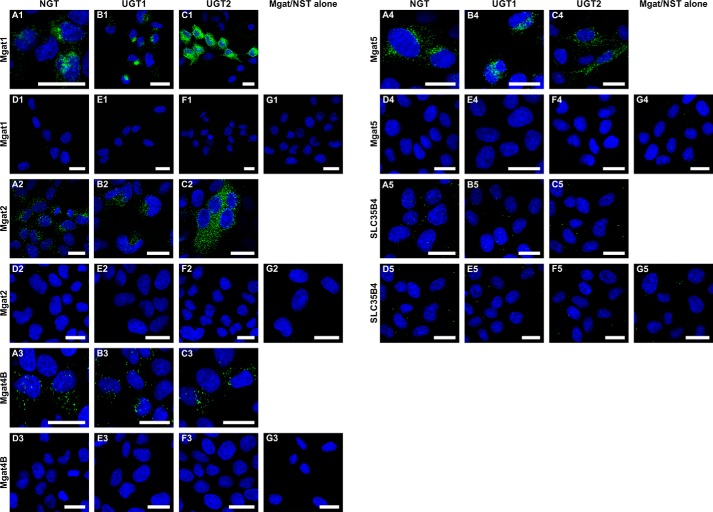
FIGURE 3.
Visualization of interactions between overexpressed Mgats and UDP-sugar transporters using in situ PLA. A–C, PLA analysis of either Mgat1 (panels 1), Mgat2 (panels 2), Mgat4B (panels 3), Mgat5 (panels 4), or SLC35B4 (panels 5) putative interaction with NGT (A), UGT1 (B), and UGT2 (C). D, negative control for HA-NGT and FLAG-Mgats/SLC35B4 interaction analysis, where primary antibodies were not added during the PLA procedure. E, negative control for HA-UGT1 and FLAG-Mgats/SLC35B4 interaction analysis, where primary antibodies were not added during the PLA procedure. F, negative control for HA-UGT2 and FLAG-Mgats/SLC35B4 interaction analysis, where primary antibodies were not added during the PLA procedure. G, negative control for HA-tagged UDP-sugar transporters and FLAG-Mgats/SLC35B4 interaction analysis, where MDCK-RCAr cells expressing only FLAG-Mgats/SLC35B4 were used, and anti-FLAG antibody was omitted during the PLA procedure. Bars, 20 μm.

