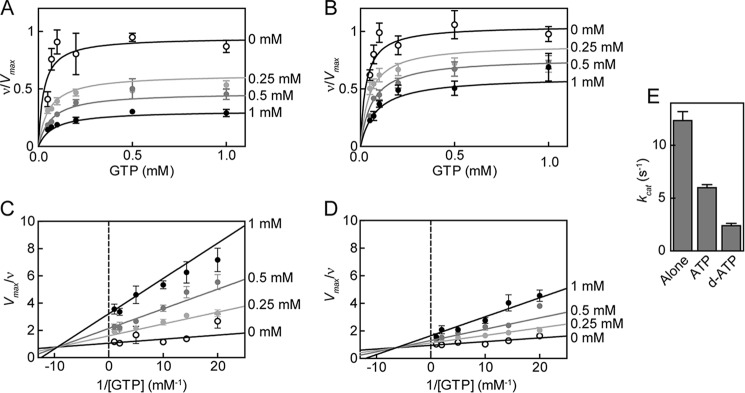
FIGURE 4.

ATP inhibition of sGC in the xsNO state for WT and DM. Changes in activity with increasing concentrations of ATP for WT (A) and DM (B) sGC. Data are replotted as double reciprocal plots for WT (C) and DM (D). sGC (0.1 μg) wild type or variant was assayed in 50 mm HEPES, pH 7.4, 6 mm MgCl2, and 1 mm DTT in the presence of 0.1 mm DEA NONOate. Each curve was fit to mixed type inhibition with two binding sites (Equations 1–3). sGC inhibition of 2′-deoxy-ATP compared with ATP (E). sGC (0.1 μg) was assayed in 50 mm HEPES, pH 7.4, 6 mm MgCl2, and 1 mm DTT with 0.1 mm DEA NONOate in the absence and presence of 0.5 mm ATP and 0.5 mm 2′-deoxy-ATP (d-ATP). Error bars, S.E.
