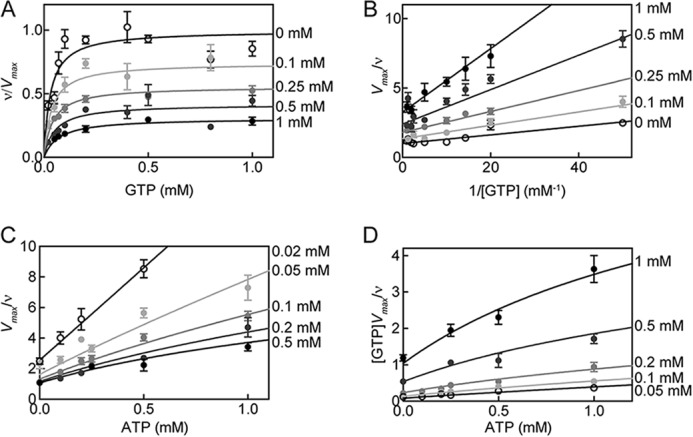
FIGURE 7.

ATP inhibition of WT sGC activity in the excess NO state. The reaction rate of sGC as a fraction of the maximal reaction rate was plotted versus the concentration of substrate (GTP) in the presence of various ATP concentrations. Curves belonging to Equations 5–7 are depicted with data (A). B, Lineweaver-Burk plot of the data and curves; C, Dixon plot of the data and curves; D, Cornish-Bowden plot of the data and curves. Error bars, S.E.
