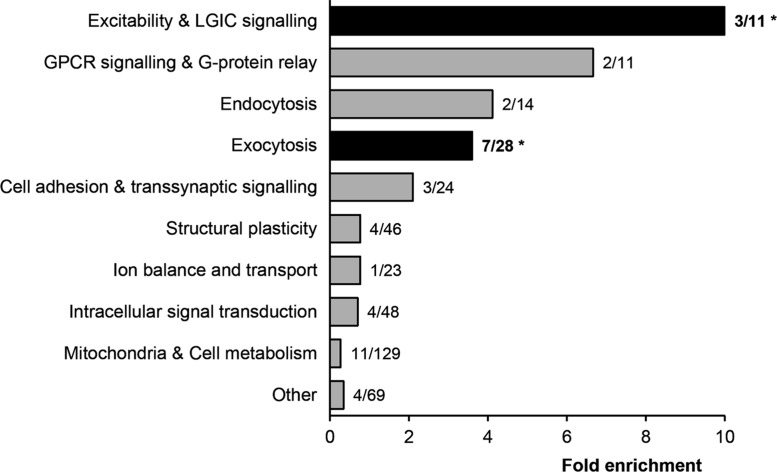
FIGURE 2.
Over-representation analysis of strain-specific hippocampal protein expression. The 403 proteins identified by iTRAQ were grouped according to molecular function, and fold enrichment (bars) was determined. Labels show the number of differentially expressed proteins over the total number of proteins detected in that category (e.g. for exocytosis: 7 out of 28 proteins were significantly regulated). Both exocytosis (p = 0.004) and excitability and LGIC signaling (p = 0.018) were significantly over-represented in this analysis (determined with a hypergeometric test).

