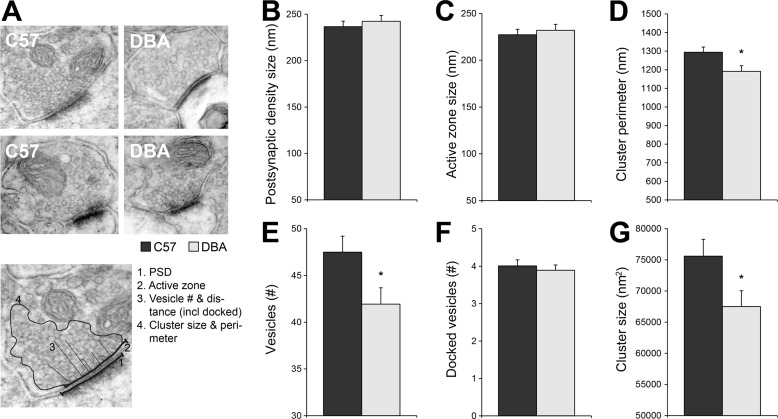
FIGURE 4.
Ultrastructural analysis of CA3 to CA1 synapses. A, when C57 was compared with DBA, no significant differences were observed for the length of the PSD (B; p = 0.598) or the AZ (C; p = 0.713) in the CA1 stratum radiatum and receiving CA3 synapses. However, DBA mice showed less synaptic vesicles (E; p = 0.025) and a decrease in cluster size (G; p = 0.036) and cluster perimeter (p = 0.014; D). F, although the total number of vesicles was lower in DBA mice, the number of docked vesicles was not affected. The analysis consisted of n = 125 C57 and n = 120 DBA synapses from four animals per strain.

