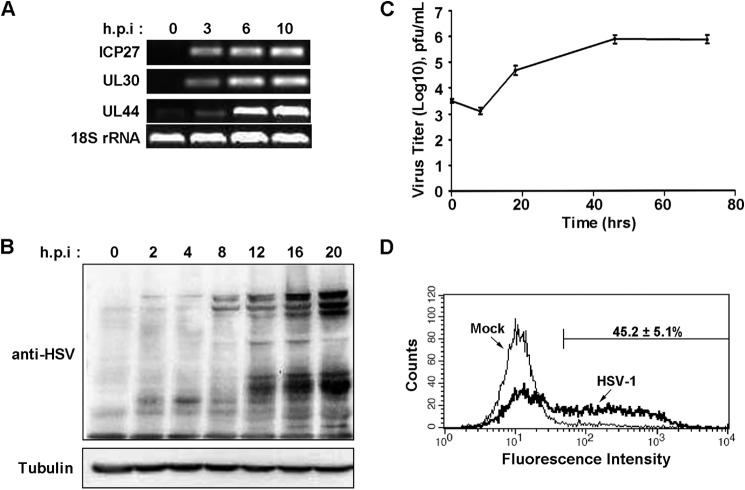
FIGURE 1.
Productive infection of Jurkat T-cells by HSV-1. A, Jurkat T-cells were infected with HSV-1 at 1 pfu/cell. At the indicated hours post-infection, cells were collected, and total RNA was extracted for RT-PCR amplification of viral genes: ICP27 (IE gene), UL30 (E gene), UL44 (L gene), and cellular 18S rRNA as an internal control. B, whole cell lysates were prepared for Western blot analysis using polyclonal antibody against HSV-1 or tubulin. C, virus was titrated at the indicated hours post-infection, and the growth curve was plotted with the log (10) plaque-forming units as the vertical axis and the time as the horizontal axis. Data are mean ± S.D. of three independent experiments. D, Jurkat T cells were mock-infected or infected with HSV-1 at 1 pfu/cell for 8 h and collected for flow cytometry analysis using anti-HSV-1 antibody. The plot is representative of three experiments, and the percentage of HSV-1 positive cells is expressed as mean ± S.D.

