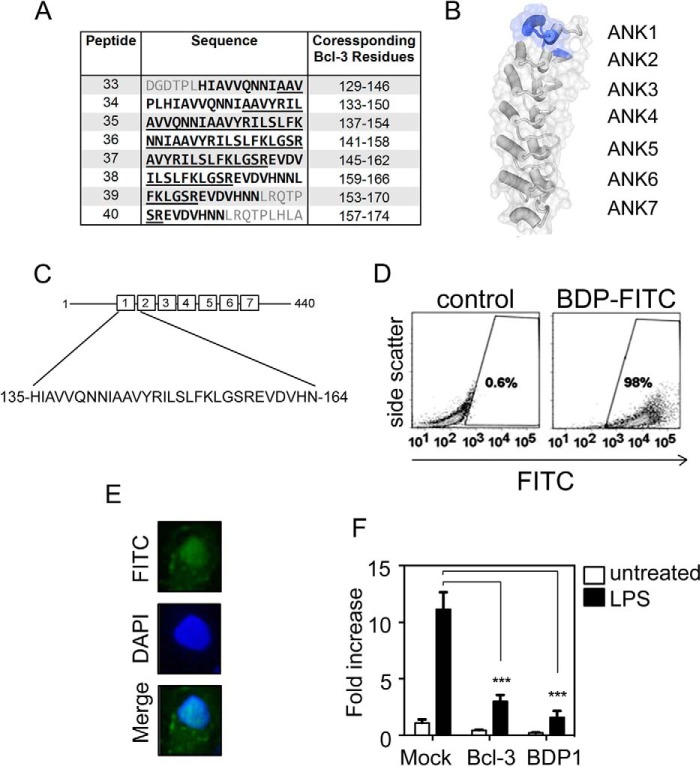
FIGURE 5.
A, sequences of Bcl-3 peptides 33–40 from the BCL-3 peptide array described in the legend to Fig. 1 with corresponding BCL-3 amino acid positions indicated. Amino acids 144–158 are underlined and amino acids 135–164 are indicated by bold type. B, BCL-3 crystal structure showing residues corresponding to BDP1 shaded in blue. C, schematic representation of murine BCL-3 with amino acids 135–164 of BDP1 indicated. D, flow cytometry analysis of RAW 264.7 following treatment with 2 μm-FITC-labeled BDP1 or vehicle control for 2 h. E, immunofluorescence analysis of HeLa cells treated with 20 μm FITC-labeled BDP for 2.5 h. F, RAW 264.7 cells were transiently transfected with the pLucp19 plasmid and BCL-3 expression vector (BCL-3) or with empty vector (Mock, BDP) for 24 h. Cells were left untreated (Mock and BCL-3) or pre-treated with 20 μm peptide as indicated for 1.5 h before stimulation with 100 ng/ml of LPS. Cells were cultured for an additional 8 h before luciferase activity was measured. The Renilla luciferase expression vector pRL-TK was used as an internal control to normalize the transfection efficiency across all samples. Il23p19 reporter activity is represented as fold-increase over untreated cells transfected with pLucp19 plasmid and empty vector expression (Mock). Transfections were performed in triplicate per experiment and data shown are mean ± S.D. and are representative of independent experiments. Statistical significance was determined two-way analysis of variance with Bonferroni post-hoc analysis, p < 0.001 (***).

