FIGURE 6.
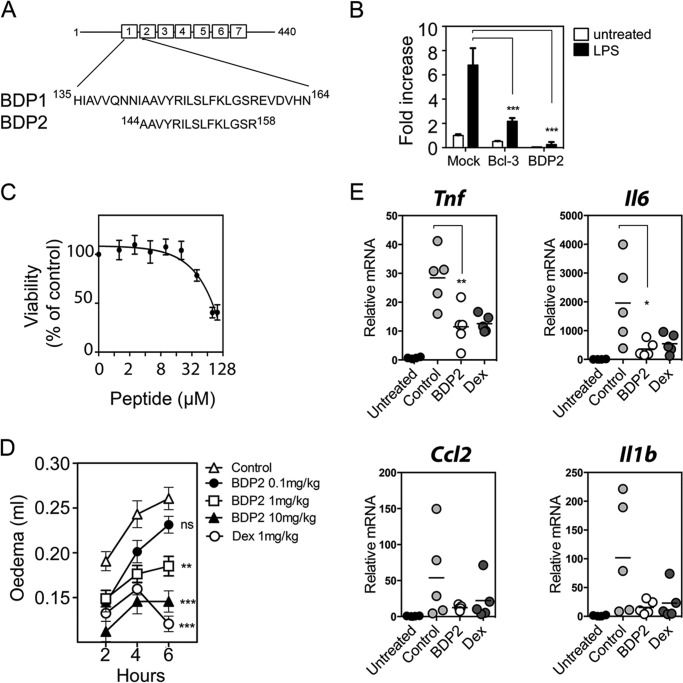
A, schematic representation of the full-length (BDP1) and shortened (BDP2) BCL-3-derived peptide sequences with corresponding murine Bcl-3 amino acid positions indicated. B, RAW 264.7 cells were transiently transfected with the pLucp19 plasmid and Bcl-3 expression vector (Bcl-3) or with empty vector (Mock and BDP2) for 24 h. Cells were left untreated (Mock and BCL-3) or pre-treated with 20 μm BDP2 peptide for 2 h before stimulation with 100 ng/ml of LPS overnight. Transfections were performed in triplicate per experiment and data shown are mean ± S.D. and representative of independent experiments. Il23p19 reporter activity was determined as described in the legend to Fig. 5. Statistical significance was determined two-way analysis of variance with Bonferroni post hoc analysis, p < 0.001 (***). C, RAW 264.7 cells were treated with increasing concentrations of BDP2 peptide (0–100 μm) for 6 h and viability was assessed by WST-1 assay. Viability is expressed as a percentage of the control (no peptide) absorbance A450 nm to A630 nm and data shown are mean ± S.D. of 3 independent experiments. Peptide concentration is presented on a Log2 scale. D, PBS (Control), BDP2 (0.1, 1, and 10 mg/kg), and 1 mg/kg of Dex were administered intraperitoneally 1 h before edema induction. 2% λ-carrageenan was administered by subplantar injection into the hind paw and edema was evaluated as the difference between basal paw volume and paw volume measured at 2, 4, and 6 h following carrageenan injection. Data shown are mean ± S.E. of individual mice. Statistical significance between control and treatment groups was determined by two-way analysis of variance with Bonferroni post hoc analysis. For clarity only statistical significance at 6 h was graphed. There was no statistical significant difference (p > 0.05) between control (n = 20) and the 0.1 mg/kg of BDP2 group (n = 8) at any time point. 1 mg/kg of BDP2 (n = 8) was significant at 4 (*) and 6 h (**), 10 mg/kg of BDP2 (n = 20) was significant at 2 (***), 4 (***), and 6 (***) h. 1 mg/kg of Dex (n = 20) was significant at 2 (**), 4 (***), and 6 (***) h. Not significant (ns), p < 0.05 (*), p < 0.01 (**), and p < 0.001 (***). E, RNA was extracted from paw tissue at 6 h post-carrageenan injection. Tnf, Il6, Ccl2, and Il1b mRNA levels were determined by real-time PCR. Data are represented as the mean ± S.E. of individual mice; control, BDP2, and Dex (n = 5) and untreated (n = 4), BDP2 (10 mg/kg) and Dex (1 mg/kg). Statistical significance was determined by one-way analysis of variance with Tukey's post hoc analysis, p < 0.05 (*), p < 0.01 (**).

