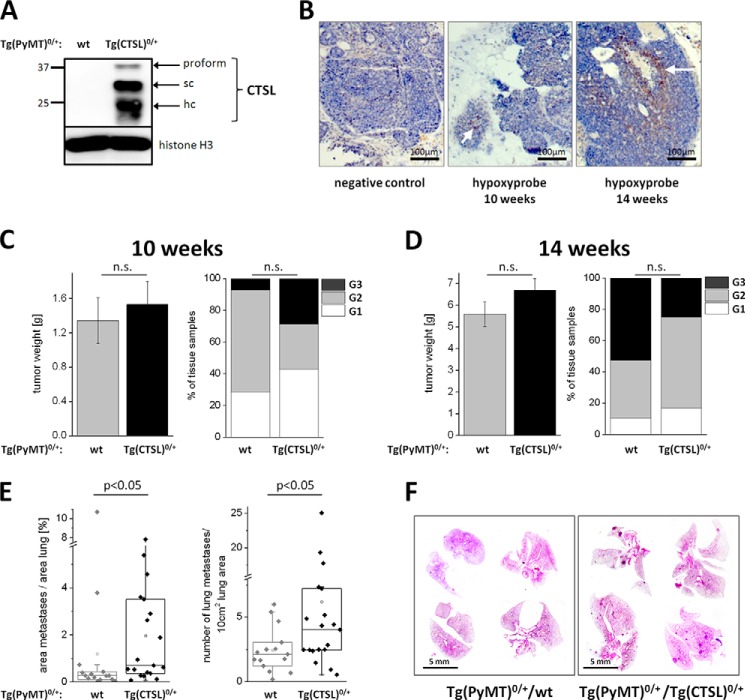
FIGURE 1.
Transgenic expression of human CTSL in MMTV-PyMT breast cancer mice. A, expression of human CTSL in primary murine breast cancer cells isolated from MMTV-PyMT mice. Immunoblot of cell lysates from tumor cells derived from PyMT mice (Tg(PyMT)0/+) without any additional transgene (wt) and mice that carry the genomic construct of human CTSL in addition to the oncogene (Tg(CTSL)0/+). The immunoblot was stained with an antibody specific for the human form of CTSL. sc, single chain form; hc, heavy chain of the two-chain form. B, hypoxia in tumors in the MMTV-PyMT model. Paraffin sections of tumors from 10- and 14-week-old mice after injection and staining of hypoxyprobe. Hypoxic areas are marked by the arrows. C, development of the primary tumor in wt versus Tg(CTSL)0/+ mice. Mass of the primary tumor in all 10 mammary glands in wt and Tg(CTSL)0/+ PyMT mice at 10 weeks (wt n = 14; Tg(CTSL)0/+, n = 21; mean ± S.E., p > 0.05, unpaired t test). Tumor grading in wt and Tg(CTSL)0/+ mice at 10 weeks was: grade 1 (G1), well differentiated; grade 2 (G2), moderately differentiated; grade 3 (G3), poorly differentiated (wt n = 14; Tg(CTSL)0/+ n = 21; p > 0.05, χ2 test). D, development of the primary tumor with 14 weeks (wt n = 19; Tg(CTSL)0/+ n = 24; mean ± S.E., p > 0.05, unpaired t test for tumor weight, χ2 test for grading). E, metastasis in wt versus Tg(CTSL)0/+ mice. Percentage of lung area that is covered by metastases and number of metastases per 10 cm2 lung area in wt versus Tg(CTSL)0/+ mice with 14 weeks (wt n = 15; Tg(CTSL)0/+, n = 19; p < 0.05, Mann-Whitney). F, representative pictures of lungs from wt versus Tg(CTSL)0/+ mice with 14 weeks in H&E staining. Lung metastases appear as dense spots within the lung parenchyma.

