FIGURE 5.
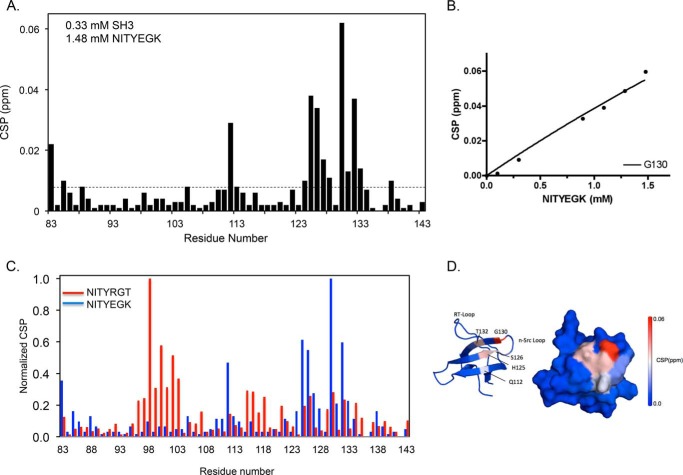
Interaction of the mutant β3/β1 peptide NITYEGK with the c-Src SH3 domain. A, CSP induced in each residue of the c-Src SH3 domain by NITYEGK. The dotted line represents 2 standard deviations for NITYEGK-induced CSP. The calculated standard deviation of NITYEGK-induced CSP was 0.004 ppm. B, plot of the magnitude of CSP in ppm for residue Gly-130 as a function of NITYEGK concentration. C, superimposition of normalized CSP induced by NITYEGK (blue) and NITYRGT (red, taken from Fig. 4). NITYEGK CSP were normalized by dividing the maximal CSP for each SH3 domain residue in NITYEGK spectra by the maximal CSP for Gly-130. NITYRGT CSP were normalized by dividing the maximal CSP for each residue in the NITYRGT spectra by the maximal CSP for Arg-98. D, CSP induced in the c-Src SH3 domain by NITYEGK are color-coded by magnitude and mapped onto an NMR structure of the SH3 domain (PDB 1NLP).

