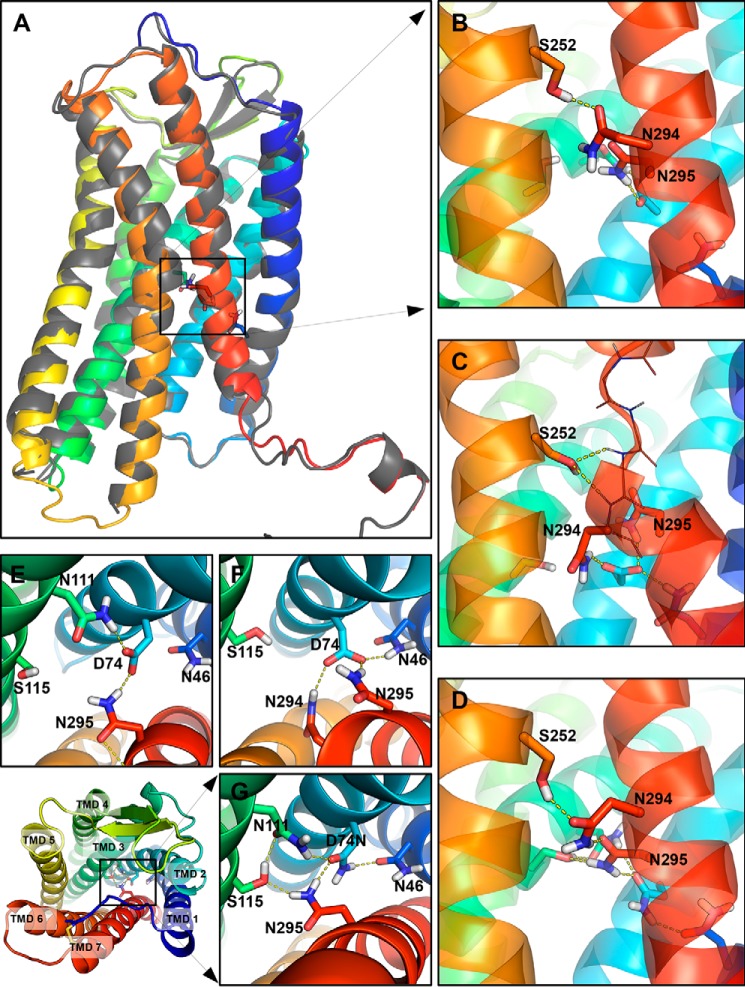
FIGURE 3.
Snapshots from the MD simulations showing interactions in the MHN in the Gq-inactive and Gq-active states. A, schematic representation of the backbone of the AT1 receptor homology model produced by the I-TASSER server (colored) closely matches the crystal structure of the CXCR4 receptor (gray). of the residues of the MHN are visible as sticks. B and E, in the WT-AT1 receptor, the side chains of S2526.47 form an H-bond with the side chain of N2947.45. The side chains of N1113.35 and N2957.46 form an H-bond with D742.50. C and F, after the conformational change in the N111G-AT1 receptor, AngII-N111G-AT1 receptor, and AngII-WT-AngII receptor; the side chain of S2526.47 can form H-bonds with backbone amines of Phe293 and Asn294 or the backbone carbonyl of Ala291 (thin line representation) to stabilize the conformational change of TMD7 (red ribbon). The side chain of D742.50 can form H-bonds with the side chains of N2947.45, N2957.46, and N461.50. D and G, in the D74N-AT1 receptor and AngII-D74N-AT1 receptor, interactions are as described for B, but additionally include an H-bond between residue D74N2.50 and N461.50 and between N2957.46 and S1153.39. Transmembrane domains are shown as colored ribbons (TMD1 = dark blue; TMD2 = light blue; TMD3 = aqua; TMD6 = orange, and TMD7 = red). Side chains are show as sticks. Oxygen atoms are red; nitrogen atoms are blue; hydrogen atoms are white, and carbon atoms are colored according to their TMD. H-bonds predicted by PyMOL are shown as yellow dashed lines.

