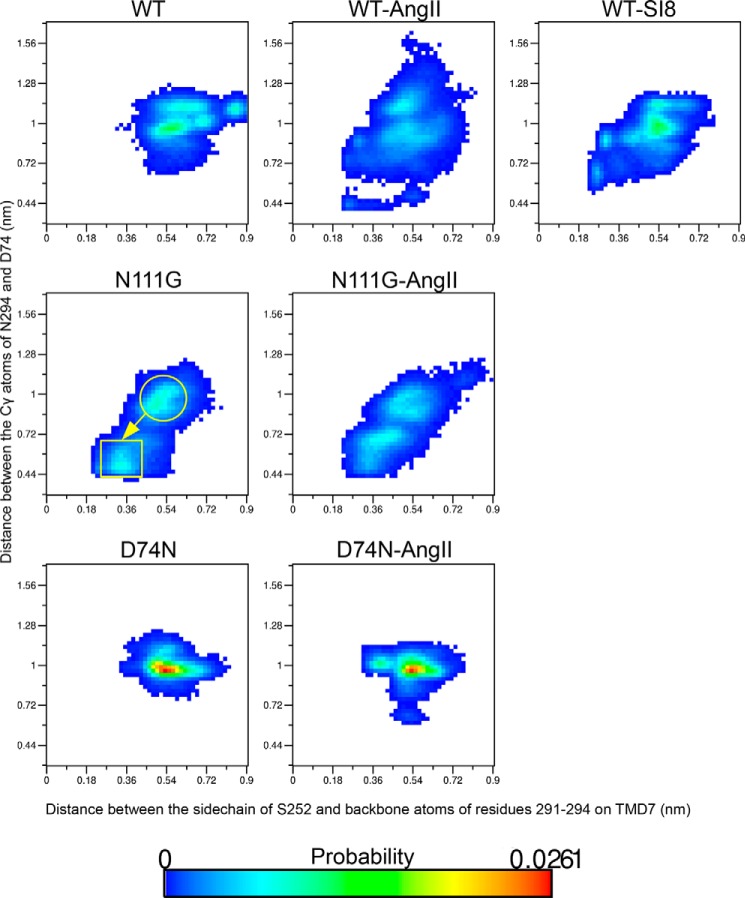
FIGURE 5.
Probability landscape generated by sorting frames of the MD simulations according to two measurements as follows: x axis, distance between the Oγ atom of residue Ser252 and the center-of-mass of backbone atoms of A2917.42 (carbonyl O), F2937.44 (amine hydrogen), and N2947.45 (amine hydrogen); y axis, distance between the Cγ atom of N2947.45 and the Cγ atom of D742.50 (or the mutated D74N).

