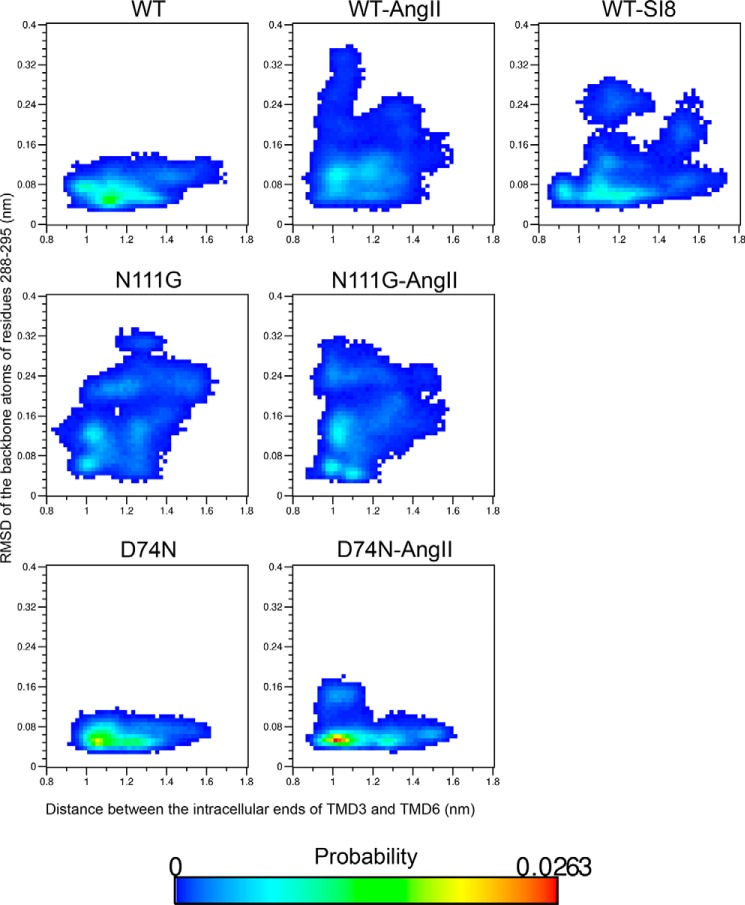
FIGURE 6.
Probability landscape generated by sorting frames of the MD simulations according to two measurements as follows: x axis, distance between the center-of-mass of backbone atoms of residues S1233.47 to Y1273.51 (intracellular extremity of TMD3) and residues I2386.33 to I2426.37 (intracellular extremity of TMD6); y axis, r.m.s.d. of the Cα atoms of residues I2887.39 through N2957.46 on TMD7.

