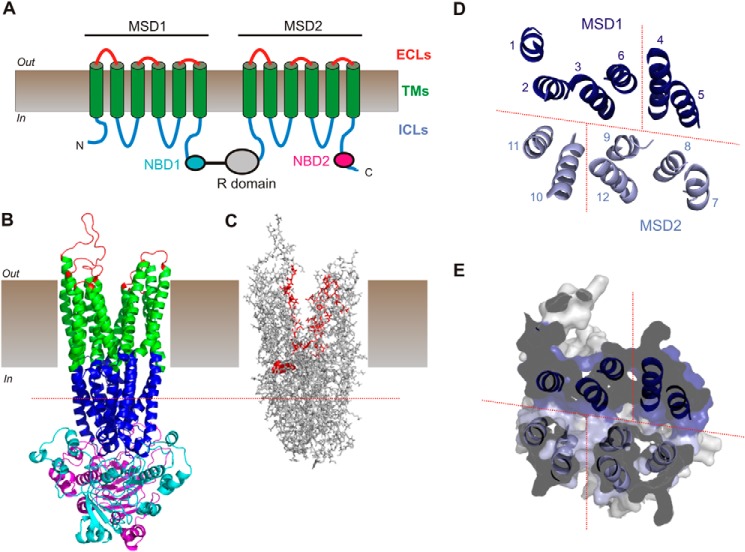
FIGURE 1.
Putative structure of the Cl− permeation pathway in CFTR. A, schematic representation of CFTR topology comprising 12 TMs (green), two NBDs (NBD1, cyan; NBD2, magenta), ICLs (blue), and extracellular loops (ECLs) (red). B, overall domain architecture of CFTR as presented in a recent atomic homology model based on the bacterial ABC protein Sav1866 (7). The same color scheme as in A illustrates the approximate extent of the different domains. The R domain is absent from this model. C, location of putative pore-forming amino acid side chains traces the Cl− permeation path in this model. TMs, ICLs, and extracellular loops only (NBDs removed) are in shown in stick representation. Those amino acids in TMs 1, 6, 11, and 12 that have been proposed to line the channel pore as reviewed recently (8) are shown in red. These residues delineate an approximately central pore through the TMs; however, the nature or location of a pathway for Cl− ion movement connecting the TMs to the cytoplasm is not apparent. One residue that has been proposed to contribute to the cytoplasmic aspect of the pore, Arg-303 at the intracellular end of TM5 (19), is shown in red as a space-filling representation for increased visibility. D and E, proposed location of putative “cytoplasmic portals” to the pore formed by the ICLs as originally proposed by Mornon et al. (see Fig. 3 in Ref. 7). D, the homology structure of the α-helical extensions of the TMs that make up the ICLs viewed from the membrane side is represented by the corresponding TM extension (i.e. “1” refers to the cytoplasmic extension of TM1). Mornon et al. (7) proposed that up to four lateral portals could connect the central pore to the cytoplasm; the approximate locations of these putative pathways are shown as red dashed lines. E, location of these putative portals in a cut-away cross-sectional view of the ICLs (see also Ref. 7). The putative portal between TMs 4 and 6 is not visible in this section and may be located slightly more toward the cytoplasmic side (7). The approximate level of this section is illustrated by the red dashed line in B and C. CFTR model structures (B–E) were visualized with PyMOL (39) using coordinates provided by Mornon et al. (7).

