
FIGURE 3.
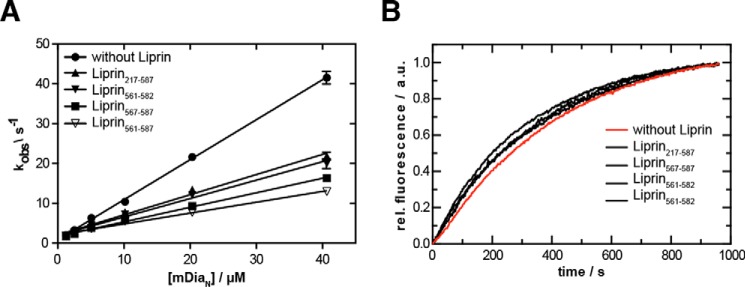
Stopped-flow analysis of the influence of liprin-α3 on the mDiaN·RhoA interaction dynamics. A, association rate constant. Mant-GppNHp-loaded RhoA was titrated with increasing concentrations of mDiaN together with/without different liprin-α3 fragments. The observed association rate constants (kobs) were plotted against the mDiaN concentration. The association rate constants (ka) correspond to the slope of the linear fit. B, dissociation rate constant. A preformed mDiaN·RhoA·mant-GppNHp complex was mixed with a 100-fold excess of active RhoA Q63L, and the increase in fluorescence was followed over time. The data followed a single exponential behavior. Error bars, S.D.