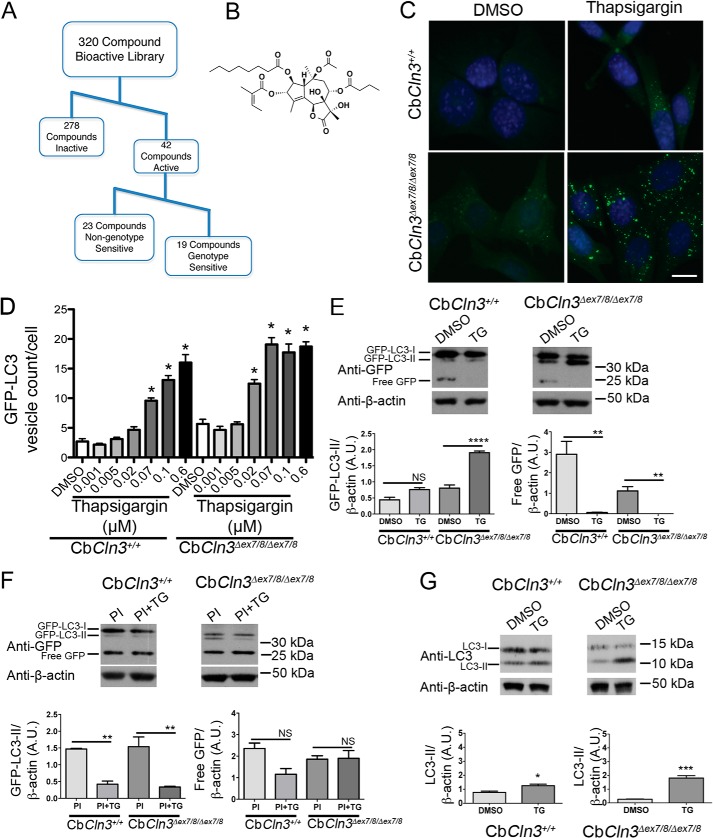
FIGURE 1.
CbCln3Δex7/8/Δex7/8 cell lines are more sensitive to thapsigargin treatment than CbCln3+/+ cells. A, workflow for hit identification and categorization of activities for our primary screening data is shown. B, structure of thapsigargin, a sesquiterpene lactone and a specific, noncompetitive inhibitor of the sarco/endoplasmic reticulum Ca2+-ATPase is shown. C, representative epifluorescence images are shown of wild type (CbCln3+/+) and homozygous CbCln3Δex7/8/Δex7/8 cells stably expressing GFP-LC3 (green) following DMSO or thapsigargin treatment. Nuclei were stained with DAPI. Scale bar, 10 μm D, GFP-LC3 vesicle counts per cell were quantified and plotted in the bar graph from dose-response analysis of thapsigargin (0.001–0.6 μm) in the CbCln3+/+ and CbCln3Δex7/8/Δex7/8 cells. Mean values are from N of 9–12 images per genotype/treatment (∼4–12 cells per image) from a representative experiment. Error bars represent S.D. Two-way ANOVA revealed a significant effect of genotype (p < 0.0001) and treatment (p < 0.0001) and a significant interaction effect (p < 0.0001). Statistical significance from post hoc Bonferroni analysis is shown (*, p < 0.0001). E, representative immunoblots probed with a GFP antibody are shown. Triplicate lysates prepared from CbCln3+/+ and CbCln3Δex7/8/Δex7/8 cells were assessed for relative forms of the GFP-LC3 transgene, including the cytoplasmic form (GFP-LC3-I), the autophagosome-associated form (GFP-LC3-II), and for free GFP. TG = thapsigargin and PI = protease inhibitors. Blotting for β-actin levels was used as a load control. Positions of the molecular weight standards are shown to the right of the immunoblots. kDa = kilodaltons. F, results from densitometry of GFP-LC3-II and free GFP bands on triplicate lysates are shown in the bar graphs. Statistical significance (Bonferroni) for the indicated comparisons (lines) are shown. NS, not significant, ****, p < 0.0001; **, p < 0.01. For E and F, samples for these analyses were run on the same blot; intervening replicate lanes were cropped from the blot images shown. G, representative immunoblots probed with an LC3 antibody to detect endogenous LC3-I and LC3-II are shown, and results from densitometry of LC3-II on triplicate lysates are shown in the bar graphs. Samples for this analysis from each cell line were run on separate blots; replicate lanes are cropped out. Statistical significance (Student's t test) values are shown. *, p < 0.05; ***, p < 0.001. A.U., arbitrary units.

