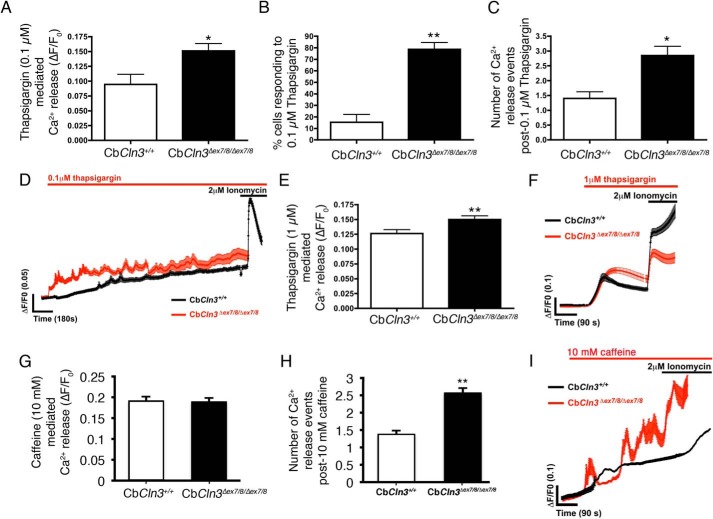
FIGURE 8.
Ca2+ analysis in response to thapsigargin treatment. A, bar graph depicts Ca2+ measurements in CbCln3+/+ (white bars) and CbCln3Δex7/8/Δex7/8 cells (black bars) using Fura-2AM (baseline normalized, ΔF/F0) following low-dose (100 nm) thapsigargin treatment. *, p < 0.05. B, bar graph depicts the number of cells in the fields of view that responded to 100 nm thapsigargin, expressed as a % of total cell number. **, p < 0.01. C, bar graph depicts the number of Ca2+ release events observed following 100 nm thapsigargin treatment in CbCln3+/+ and CbCln3Δex7/8/Δex7/8 cells. *, p < 0.05. D, fura-2AM (ΔF/F0) traces of CbCln3+/+ (black line) and CbCln3Δex7/8/Δex7/8 cells (red line) with low-dose (100 nm) thapsigargin treatment are shown. Multiple releases are evident as spikes in the traces, which were frequently observed over the recording period in the CbCln3Δex7/8/Δex7/8 cells and were only occasionally observed in the CbCln3+/+ cells. Recording following 2 μm ionomycin treatment shows emptying of the remaining ER Ca2+ pool. E, bar graph depicts Ca2+ measurements in CbCln3+/+ and CbCln3Δex7/8/Δex7/8 cells using Fura-2AM (baseline normalized, ΔF/F0) following 1 μm thapsigargin treatment. **, p < 0.01. F, fura-2AM (ΔF/F0) traces of CbCln3+/+ (black line) and CbCln3Δex7/8/Δex7/8 cells (red line) with 1 μm thapsigargin treatment are shown. A single release at this dose was evident in the traces, which was slightly higher in the CbCln3Δex7/8/Δex7/8 cells compared with CbCln3+/+ cells. Recording following 2 μm ionomycin treatment shows emptying of the remaining ER and nonlysosomal Ca2+ stores indicating cells remain viable. Error bars represent S.E. G, bar graph depicts Ca2+ measurements in CbCln3+/+ (white bars) and CbCln3Δex7/8/Δex7/8 cells (black bars) using Fura-2AM (baseline normalized, ΔF/F0) following 10 mm caffeine treatment to mobilize the ER pool from the ryanodine receptor. H, bar graph depicts the number of Ca2+ release events observed following 10 mm caffeine treatment in CbCln3+/+ and CbCln3Δex7/8/Δex7/8 cells. **, p < 0.01. I, fura-2AM (ΔF/F0) traces of CbCln3+/+ (black line, average from ∼100 cells) and CbCln3Δex7/8/Δex7/8 cells (red line, average from ∼100 cells) with 10 mm caffeine treatment in Ca2+-free buffer are shown. Multiple releases were evident as spikes in the traces during the recording period in the CbCln3Δex7/8/Δex7/8 cells. Recording following 2 μm ionomycin treatment shows emptying of the remaining ER Ca2+ pool. For Ca2+ measurements, ≥60 cells were analyzed from three to four independent experiments.

