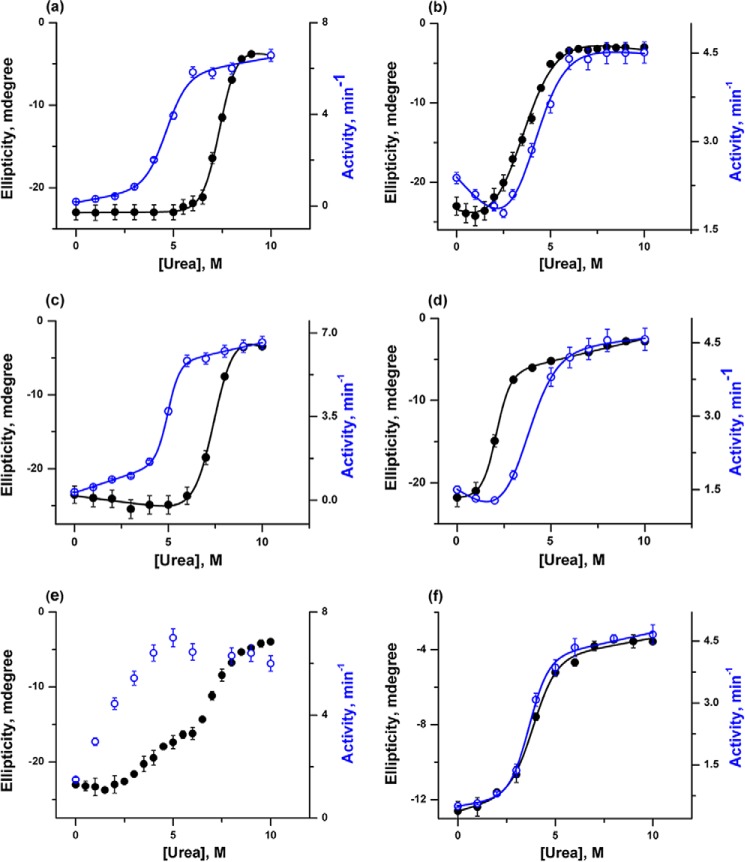
FIGURE 3.
Urea-induced unfolding transitions were monitored by far-UV CD at 222 nm (black) and peroxidase activity (blue) for h-cyt c (a) and y-cyt c (b) in the absence of CDL, h-cyt c (c) and y-cyt c (d) in the presence of 6 μm CDL, and h-cyt c (e) and y-cyt c (f) in the presence of 50 μm CDL. The unfolding transitions (except those shown in e) were fit to a two-state unfolding model, and the thermodynamic parameters are given in Table 1. The transitions shown in Fig. 3e could not be fit to a two-state model.

