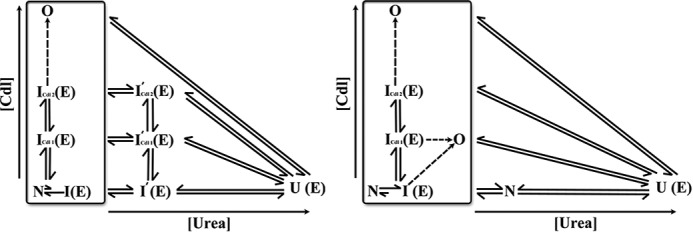
FIGURE 7.

CDL binding (vertical axis) and urea-induced unfolding (horizontal axis) of h-cyt c (left) and y-cyt c (right) are shown. The designations N and E in parentheses indicate whether a particular state samples the compact (N) or extended conformer (E). The h-cyt c intermediates I′cdl1 and I′cdl2 (left) are defined based on urea unfolding data probed by far-UV CD and peroxidase activity (see Fig. 3, a, c, and e). Although the FCS data were analyzed using a generic intermediate state (I), this figure uses different symbols for the intermediates depending on the solution conditions.
