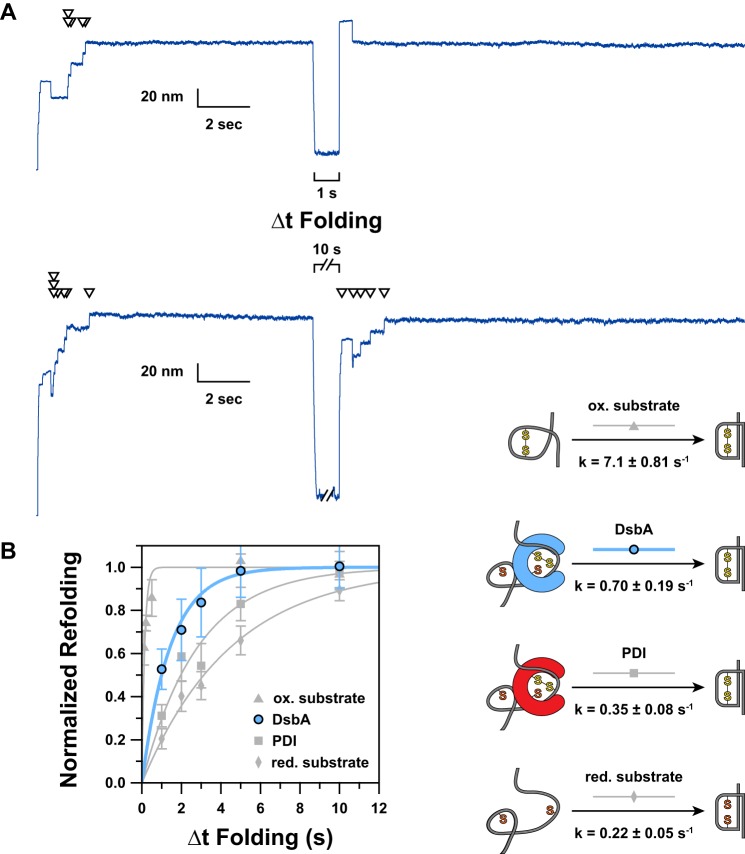
FIGURE 3.
A, representative extension traces demonstrating the effect of varying Δt Folding are shown. Arrowheads indicate ∼13-nm “reduction” steps, each of which directly corresponds to a single folded and oxidized domain. In the upper trace, a 1-s Δt Folding is applied. The absence of steps in the probe period indicates an absence of refolding and reoxidation occurring during the short Δt Folding. A 10-s Δt Folding is used in the lower trace, allowing five of seven domains to complete oxidative folding. B, by varying Δt Folding and plotting the fractional recovery of natively oxidized domains, we were able to measure the kinetics of DsbA-catalyzed oxidative folding (blue circles). For comparison, we have shown our previous data (gray symbols) for the kinetics of PDI-catalyzed oxidative folding (squares) as well as the folding kinetics for oxidized (triangles) and reduced (diamonds) substrate in the absence of enzyme (23). Error bars represent S.E., calculated using the bootstrap method. Solid lines represent single exponential models of the data, with the rate (k) parameter provided in the schematic to the right. The data have been normalized by multiplying by the inverse of the amplitude of a single exponential fit of the unnormalized data; thus the amplitude for all fits is 1.0. To the right of the plot, we have indicated a schematic representation of the process being measured. ox., oxidized; red., reduced.

