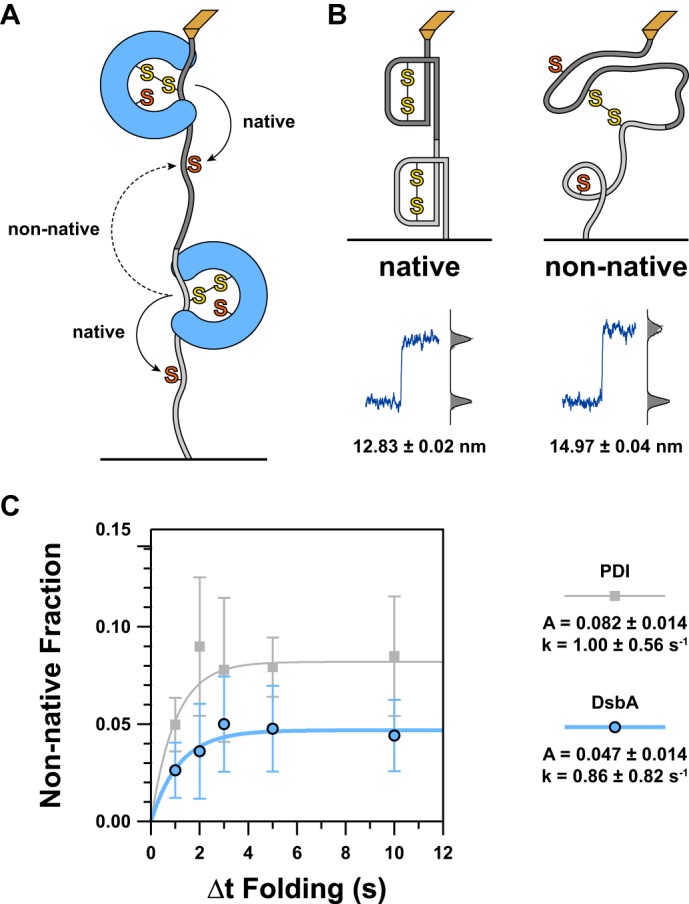
FIGURE 4.

A, because we are using a tandem polyprotein substrate, interdomain disulfides can form between adjacent domains. The schematic diagram illustrates how this can occur with solid arrows representing the general trajectory necessary for a native disulfide and a dashed arrow representing that of a non-native interdomain disulfide. For simplicity, just two domains are shown, but this scenario can arise at the junction between any adjacent pair of domains in the substrate. B, as more residues are exposed to force upon reduction of a non-native disulfide compared with a native disulfide, there is a larger increase in extension. The schematics represent the condition of two domains that will, when extended, lead to native (left) or non-native (right) reductions. A typical representation of the resultant length recording is shown below each illustration. A histogram of the data is shown to the right of this with step sizes calculated from the difference between the centroids of the Gaussian fits shown below. C, to determine the kinetics of non-native disulfide formation, we plotted the proportion of non-native to native reduction steps as a function of Δt Folding. As before, data for DsbA are shown in blue circles, and our previous data for PDI are shown in gray squares (23). For both enzymes, we found that non-native disulfides form with a rate significantly faster than the rate of catalyzed oxidative folding. However, the amount of non-native disulfides quickly levels off and asymptotically approaches a value of about 1 in 21 domains (DsbA) or about 1 in 12 domains (PDI). The discrepancy in amplitude indicates that DsbA is less likely to cause misfolding or incorrect disulfide pairings than PDI. Error bars represent S.E., calculated using the bootstrap method. Solid lines represent single exponential models of the data, with the rate (k) and amplitude (A) parameters provided in the legend to the right.
