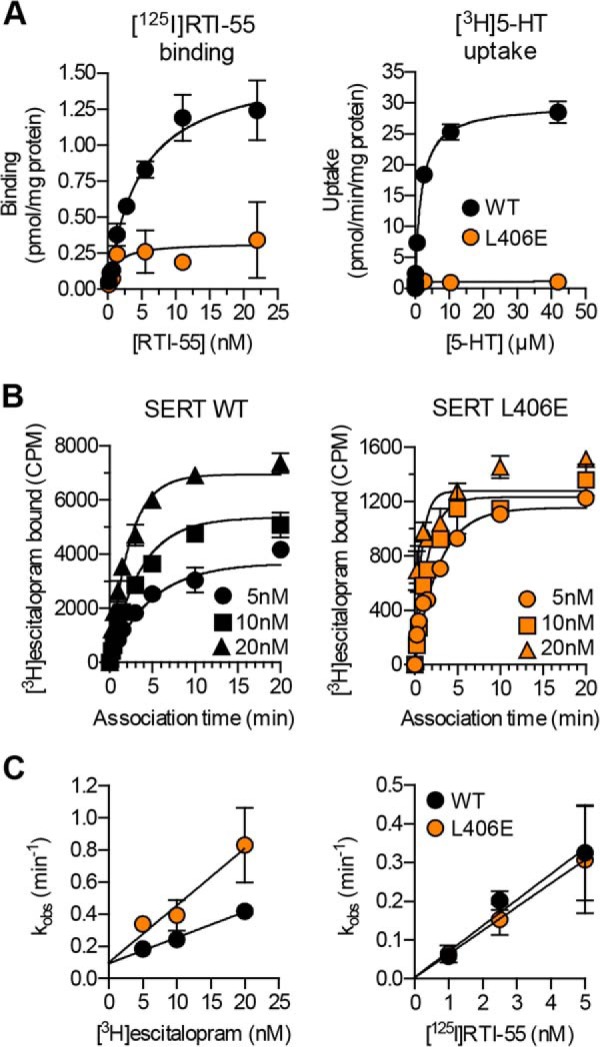
FIGURE 6.

The L406E mutation affect the basal transporter function and inhibitor binding kinetics. A, dose-response curves from representative whole cell [125I]RTI-55 saturation binding (left) and [3H]5-HT saturation uptake (right) experiments, which were carried out for SERT WT and SERT L406E using transiently transfected COS7 cells (see “Experimental Procedures”). Data points represent the mean ± S.E. from triplicate determinations of accumulated radioactivity in cells incubated with increasing concentrations of RTI-55 or 5-HT. B, representative curves from a [3H]escitalopram kinetic binding experiment. Membrane preparations of COS7 cells expressing SERT WT (left) or SERT L406E (right) were incubated with the indicated concentrations (5, 10, or 20 nm) of [3H]escitalopram and the binding reaction was allowed to proceed for up to 20 min before the binding reaction was terminated by rapid washing. Data points represent the mean ± S.E. from triplicate determinations of accumulated radioactivity (CPM). Similar experiments were also carried out for [125I]RTI-55, using 1, 2.5, and 5 nm, respectively, of the radioligand (curves not shown). C, the pseudo-first order rate constant (kobs) calculated from the experiments outlined in B was plotted as a function of radioligand concentration. Data points represent the mean ± S.E. from at least three independent experiments each performed in triplicate.
