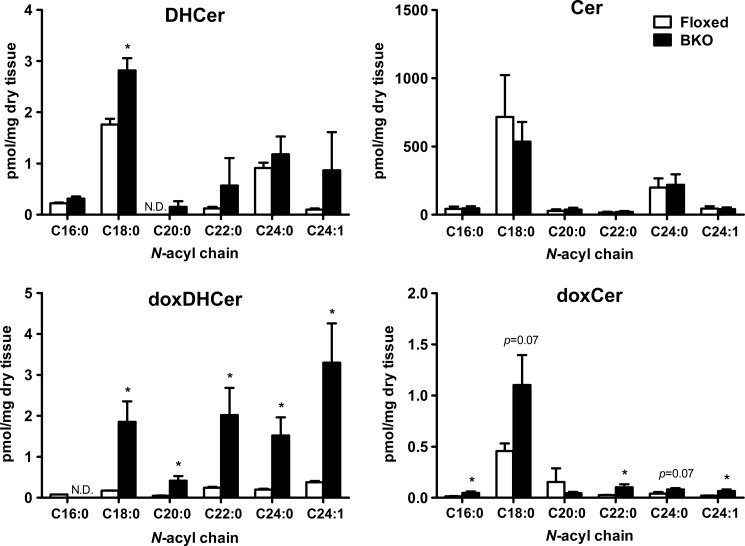
FIGURE 7.
Fatty acid profile of N-acyl derivatives present in the brains of BKO and control (floxed) mice. Lipids were extracted from brain homogenates and analyzed using LC-MS. The data are means ± S.E. (floxed, n = 7; BKO, n = 8). Differences between the two groups were analyzed using the Student's t test (*, p < 0.05; **, p < 0.01; ***, p < 0.001). N.D., not detected.

