FIGURE 2.
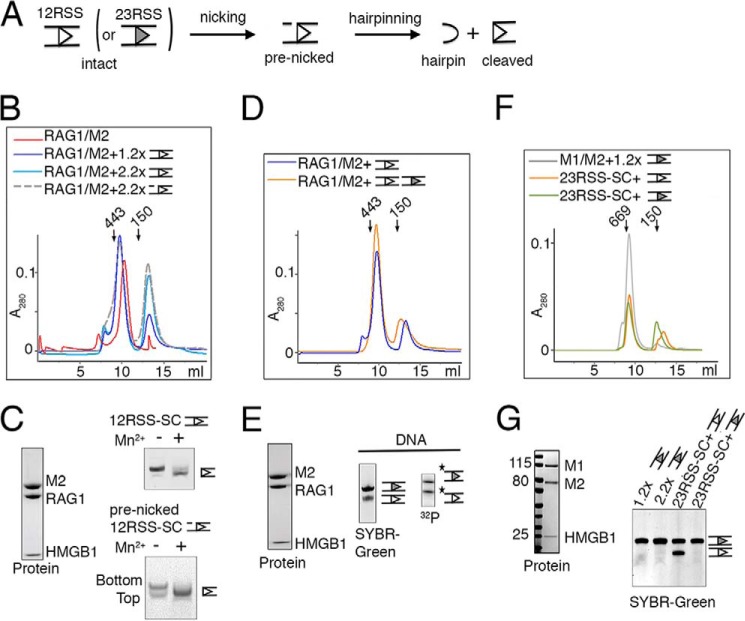
RAG1/2 forms an SC with one copy of 12RSS or 23RSS. A, schematic representation of the RSS cleavage reaction and DNA substrate used in PC formation. B, superimposition of gel-filtration profiles of the RAG1/M2 protein complex alone and after incubation with 1.2:1 or 2.2:1 molar excess of 12RSS substrate (blue lines) or 2.2:1 molar excess of pre-nicked 12RSS (gray dashes). The elution profile of the pre-nicked 12RSS at 1.2:1 molar ratio was identical to that of the intact 12RSS at the same molar ratio and thus is omitted for clarity. The 12RSS-SC complex (355 kDa) was readily identifiable by the peak shift when compared with RAG1/M2 protein alone. Arrows indicate the elution points of molecular mass markers (443 and 150 kDa). The excess 12RSS (intact or pre-nicked) was eluted in a later peak. C, analysis of the elution peak of the 12RSS-SC by SDS-PAGE and denaturing TBE-urea gel stained by Coomassie Blue and SYBR Green, respectively. The DNA gel also shows double-strand cleavage by purified 12RSS-SC in Mn2+. D, superimposed gel-filtration profiles of the 12RSS-SC (blue) and its conversion to PC (orange, 386 kDa) after incubation with 23RSS (gray filled triangle). The excess of free DNA was eluted after SC and PC. E, analysis of components of the PC peak by SDS-PAGE and denaturing TBE-urea gel electrophoresis (stained by SYBR Green). 32P labeling of the PC peak showed that the 12RSS and 23RSS are present in 1:1 molar ratio. The 32P labels on DNA strands are marked with asterisks. F, superposition of gel-filtration profiles of 23RSS-SC formation (which did not alter by the addition of more 23RSS (green)), and its conversion to PC after the addition of 12RSS (orange). Because both RAG1 and RAG2 were MBP-tagged, the molecular masses of SC and PC were 446 and 468 kDa. Due to the flexible linkers, their apparent sizes appeared to be larger than the calculated values. The elution points of molecular mass markers (669 and 150 kDa) are indicated by arrows. G, the protein and DNA components of 23RSS-SC and PC were confirmed by SDS and TBE-urea gels. In panels C, E, and G, the open and filled triangles represent 12RSS and 23RSS, respectively, as shown in panel A.

