
FIGURE 4.
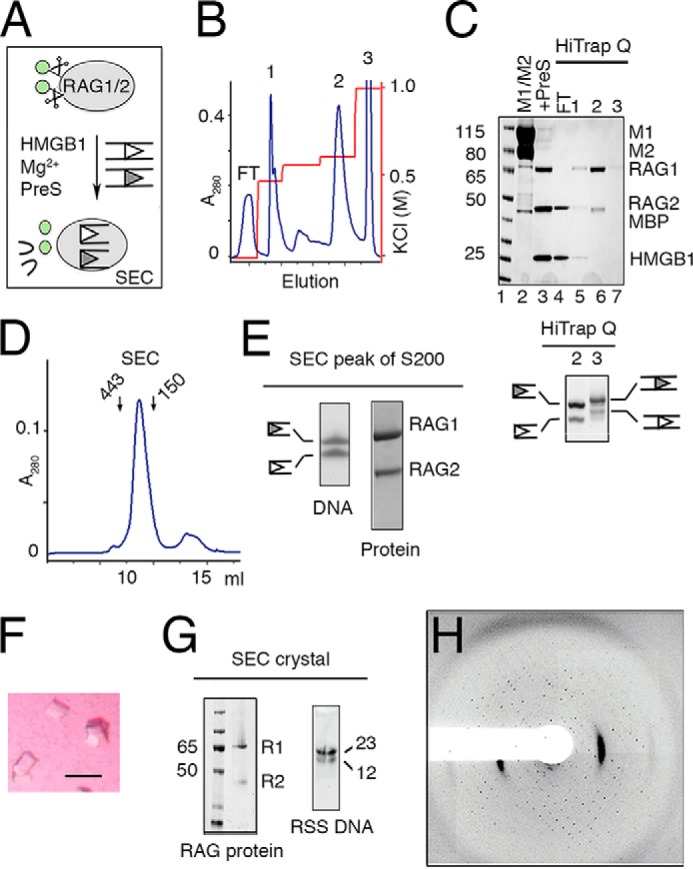
Preparation and crystallization of SEC. A, schematic of SEC production. RAG1/2 (gray oval) with cleavable MBP (green circles) was incubated with RSS DNAs (open and filled triangles) and HMGB1. After cleavage of RSS DNAs in the presence of Mg2+, MBP tags were removed by PreScission protease (PreS). B, elution profile of the reaction mixture applied onto a HiTrap Q ion-exchange column. HMGB1, MBP, unreacted RAG1/2, and free DNA were eluted at different concentrations of KCl. SEC was eluted in a sharp peak at 650 mm KCl (peak 2). C, upper panel, SDS gel of M1/M2 protein (lane 2), assembled SEC after PreScission cleavage (lane 3), flow-through (FT, lane 4), and the peak fractions eluted from HiTrap Q (B). Lower panel, a SYBR Green-stained TBE-urea gel of peaks 2 (SEC) and 3 (free and intact DNA) eluted from HiTrap Q (B). D, Superdex-200 elution profile of the SEC (281 kDa) after the ion-exchange step. Arrows indicate the elution points of molecular mass markers (443 and 150 kDa). E, TBE-urea and SDS protein gels of the Superdex-200 peak fraction. F, tetragonal and square-shaped crystals of the SEC complex obtained after optimization of the DNA lengths. G, SDS-PAGE and TBE-urea gel (stained with SYBR Green) of dissolved SEC crystals after thorough wash. The crystals contained tag-free RAG1/2 (R1 and R2) and 12/23RSS DNAs. H, diffraction image of a typical SEC crystal.