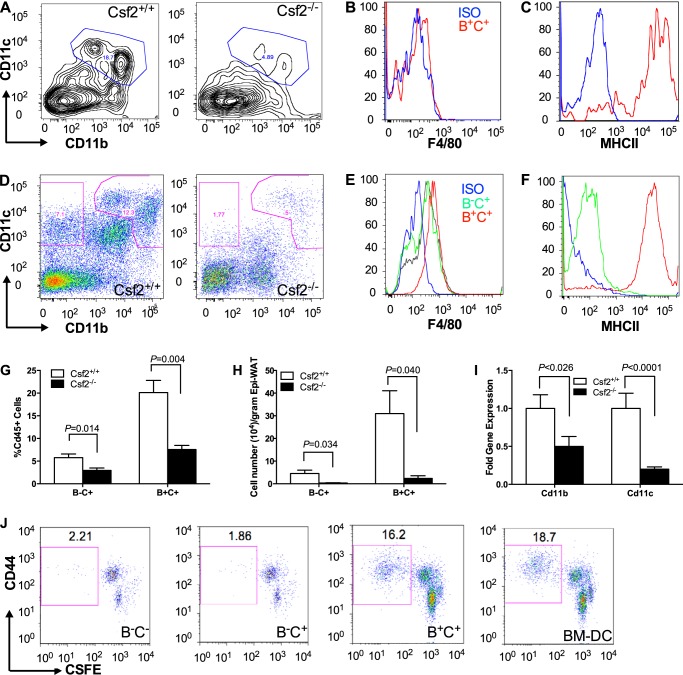
FIGURE 3.
Characterization of adipose tissue myeloid populations by surface markers, gene expression, and antigen presentation. Representative FACS plots showing CD11b- and CD11c-expressing CD45+ cells and subpopulations in 4-week-old mice (A, pooled from 10 mice) and 25-week-old mice (D, n = 12). F4/80 and MHCII expression by CD45+CD11b-CD11c+ (B−C+) and CD45+CD11b+CD11c+ (B+C+) subpopulations was measured in 4-week-old mice (B and C) and 25-week-old mice (E and F). The myeloid subpopulations were quantified for 25-week-old mice as a percentage of CD45+ cells (G) and per g of adipose tissue (H). CD11b and CD11c gene expression in the SVF of epididymal adipose depot was quantified for 25-week-old mice (I, n = 12). A T cell proliferation assay was performed to assess the antigen presentation capability of B−C+ and B+C+ myeloid subpopulations (J). Myeloid subpopulations were isolated from pooled SVF from 10 adult wild-type mice.

