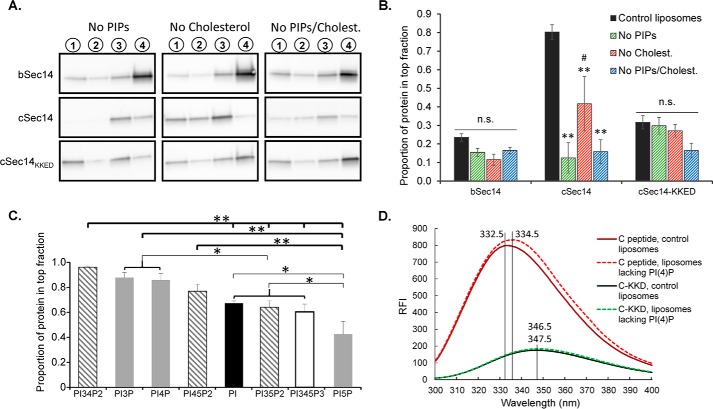
FIGURE 7.
cSec14/liposome interactions require phosphoinositides and cholesterol. A, representative blots from flotation assays using liposomes of different lipid content. B, group data showing protein content of the top fraction only for each condition. Values are relative to total protein recovery from each gradient. Data for control Golgi mix liposomes (black bars) are the same data shown in Fig. 6F, fraction 1. Error bars, S.E.; n = 5–6 experiments for “no PIP” and “no cholesterol” conditions, n = 3 experiments for “no PIP/cholesterol” condition. All statistics are by two-way ANOVA; **, p < 0.001 versus control (black bars); #, p < 0.02 versus no PIP condition (green hatched bars); n.s., not statistically significant. C, results from flotation assays using liposomes prepared with using 8% of the indicated phosphoinositide with 52% DOPC, 20% DOPE, 5% DOPS, 15% cholesterol. The bar graph shows the proportion of total cSec14 protein recovered in the top fraction. Assay conditions were as in Fig. 6. D, incubation of Kal-c peptide with Golgi mix liposomes (with PI(4)P) versus liposomes lacking PI(4)P resulted in a shift of λmax from 332.5 to 336.5 nm. The λmax for the Kal-cKKD peptide shifted slightly (from 346.5 to 347.5 nm) when PI(4)P was eliminated from liposomes; both values were within 0.5 nm of the buffer-only condition (347.0 nm) in Fig. 2D, and all were considerably red-shifted when compared with λmax values for the wild type Kal-c peptide.

