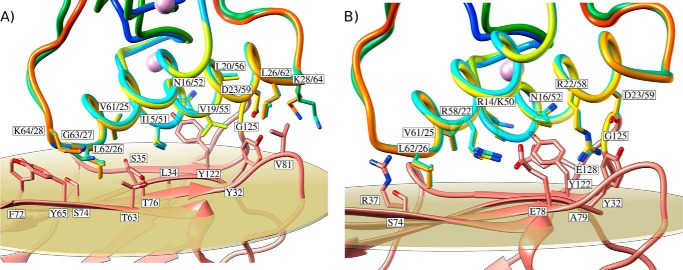
FIGURE 3.
Cohesin-dockerin interface in the two A. cellulolyticus cohesin-dockerin complexes. A, shows the hydrophobic interactions at the complex interface. B, shows the polar interactions at the complex interface. Residues at the interface are shown as sticks. The symmetry-related dockerins are overlaid and displayed color-ramped. ScaC cohesin is depicted in salmon. In both panels the residue labeling of the dockerins indicates the residue number(s) in equivalent positions on one or the other binding orientation.

