
FIG 2.
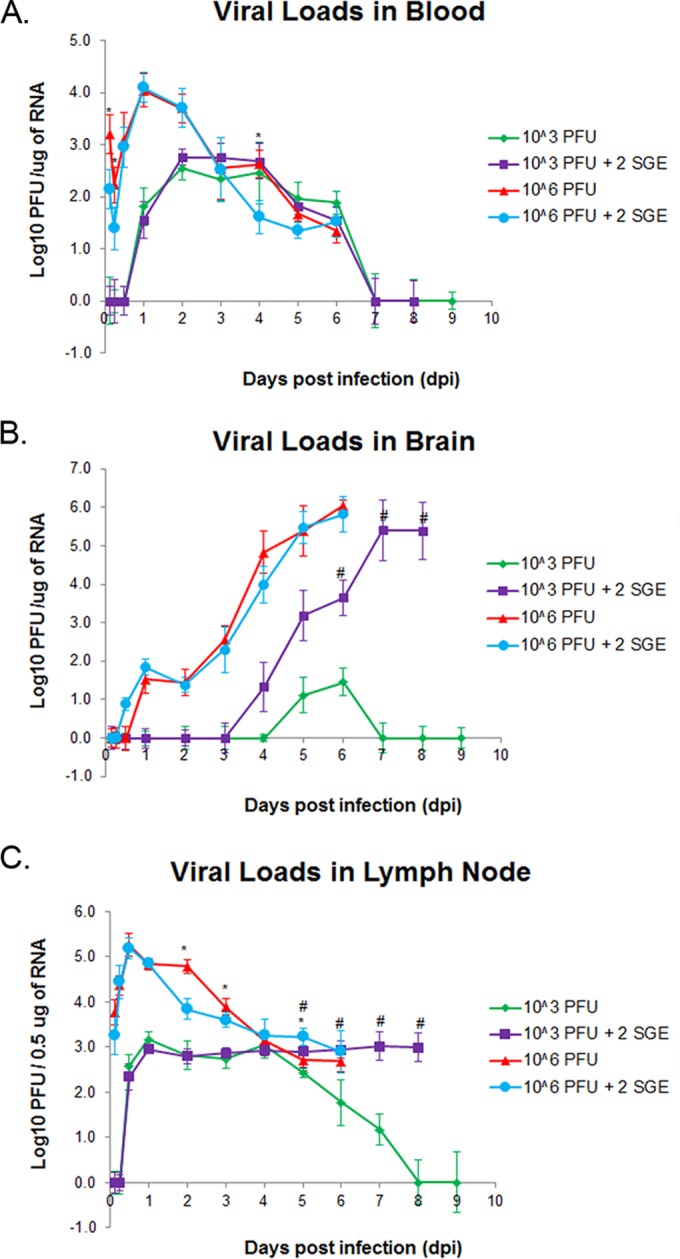
Viral load detection in blood (A), brain (B), and popliteal lymph node (C). n = 5 mice per time point and infection condition. *, P < 0.05 for 106 PFU versus 106 PFU plus 2 SGE; #, P < 0.05 for 103 PFU versus 103 PFU plus 2 SGE. The limit of detection is 10 PFU/μg RNA. Error bars indicate standard deviations. 2SGE, mice were injected with salivary gland extract from two I. scapularis adult female ticks.