
Figure 3. PD-1 expression in antiviral CD8 T cells in WT, EP2/4 DKO and mPGES1 KO mice.
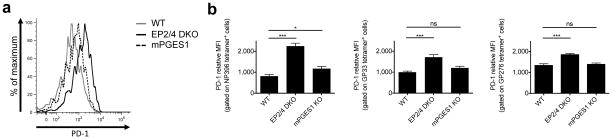
WT, EP2/4 DKO, or mPGES1 KO mice were infected with LCMV-CL13, and sacrificed at day 8 p.i. Splenic CD8 T cells were then stained with MHC class I tetramers and anti-PD-1 antibodies. (a) Histogram plot shows representative expression of PD-1 on DbNP396 tetramer-positive CD8 T cells. (b) Average MFIs of PD-1 expression for the indicated tetramer-positive populations were compiled from two experiments with a 7 total mice per group and analyzed by ANOVA. MFIs were normalized for each experiment to facilitate comparison across experiments. Error bars depict S.E.M. *P < 0.05, ***P < 0.001, and ns indicates not significant.