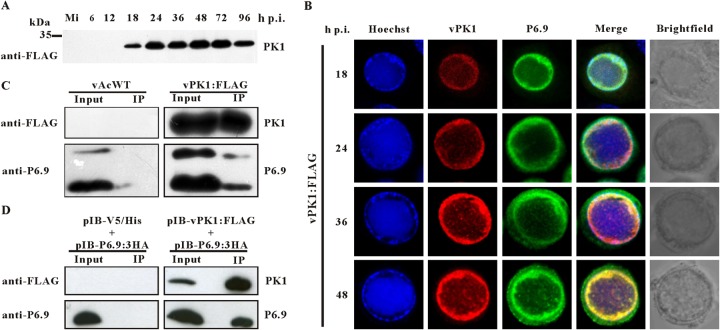
FIG 2.
PK1 interacts with P6.9. (A) Time course analysis of PK1 expression. Sf9 cells were mock infected or infected with vPK1:FLAG. At the indicated time points p.i., the cells were collected, resolved by SDS–15% PAGE, and analyzed by immunoblotting with a monoclonal anti-FLAG antibody. Mi, mock-infected cells. (B) Colocalization of PK1 and P6.9. Sf9 cells were infected with vPK1:FLAG. At the indicated time points p.i., the cells were probed with the anti-FLAG and anti-P6.9 antibody and then visualized using an Alexa Fluor 555-conjugated goat anti-mouse antibody (red) and an Alexa Fluor 647-conjugated donkey anti-rabbit antibody (green). The merged lane (yellow) shows that PK1 colocalized with P6.9. Nuclear DNA was stained with Hoechst 33342 (blue). (C) Sf9 cells were infected with vPK1:FLAG or vAcWT. At 48 h p.i., the cells were collected and lysed for immunoprecipitation with protein A/G agarose beads conjugated with an anti-FLAG antibody. The immunoblot was probed with anti-FLAG antibody to detect the expression and immunoprecipitation of PK1, and anti-P6.9 antibody was used to detect the expression and coimmunoprecipitation of P6.9. vAcWT-infected cells were used as a negative control. Input, cell lysates; IP, immunoprecipitation with protein A/G agarose beads conjugated with an anti-FLAG antibody. (D) Sf9 cells were cotransfected with pIB-PK1:FLAG and pIB-P6.9:3HA. Cells cotransfected with pIB/V5-His and pIB-P6.9:3HA were used as negative controls. At 48 h p.t., immunoprecipitation assays were performed as described above.

