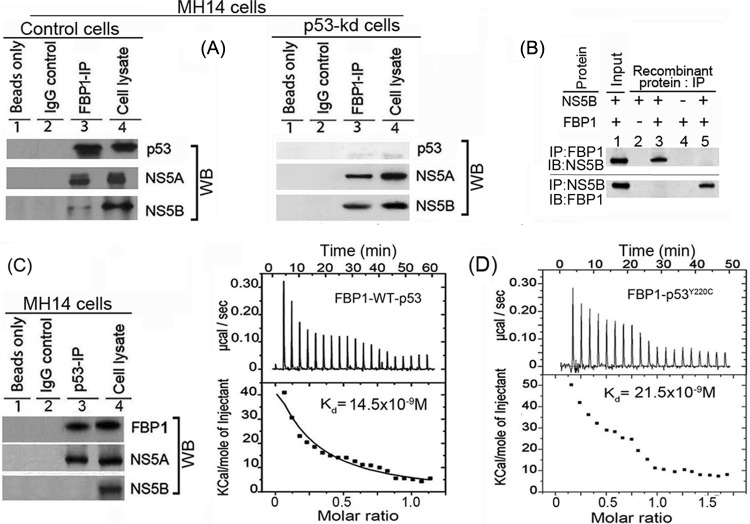
FIG 3.
FBP1 physically interacts with p53 and HCV proteins NS5B and NS5A. (A) FBP1 IP was done on RNase-treated lysates from control MH14 cells (left) or p53-kd MH14 cells (right) and Western blotted for p53, NS5A, and NS5B. Lane 1, beads only; lane 2, isotype IgG control; lane 3, IP sample; lane 4, cell lysate. (B) FBP1 IP and NS5B IP on a mixture of purified proteins pull down each other. We used 2 μg each of purified recombinant FBP1 and NS5B and carried out reciprocal IP and Western blotting for either FBP1 or NS5A. (Upper) Lanes 2 to 5, FBP1 IP immunoblotted (IB) for NS5B. (Bottom) Lanes 2 to 5, NS5B IP immunoblotted for FBP1. Lane 1, input protein controls. (C) p53 IP on the lysates from control MH14 cells. Lane 1, beads only; lane 2, isotype IgG control; lane 3, IP sample; lane 4, cell lysate. (D) Isothermal titration calorimetry of FBP1 interaction with wild-type p53 (left) and Y220C mutant p53 (right). A syringe of ITC containing purified p53 was titrated into a cell containing purified FBP1 in ITC buffer containing 20 mM sodium phosphate buffer, pH 7.8, and 150 mM NaCl at 25°C. (Top) The calorimetric data on titration of FBP1 with p53 as a function of time. (Bottom) The integrated heat per injection versus the molar ratio of p53 to FBP1. The graph corresponds to the best fit of the experimental data to a one-site model, providing a dissociation constant (37) of 14.5 nM for wild-type p53 and 21.5 nM for the Y220C mutant.

