FIG 6.

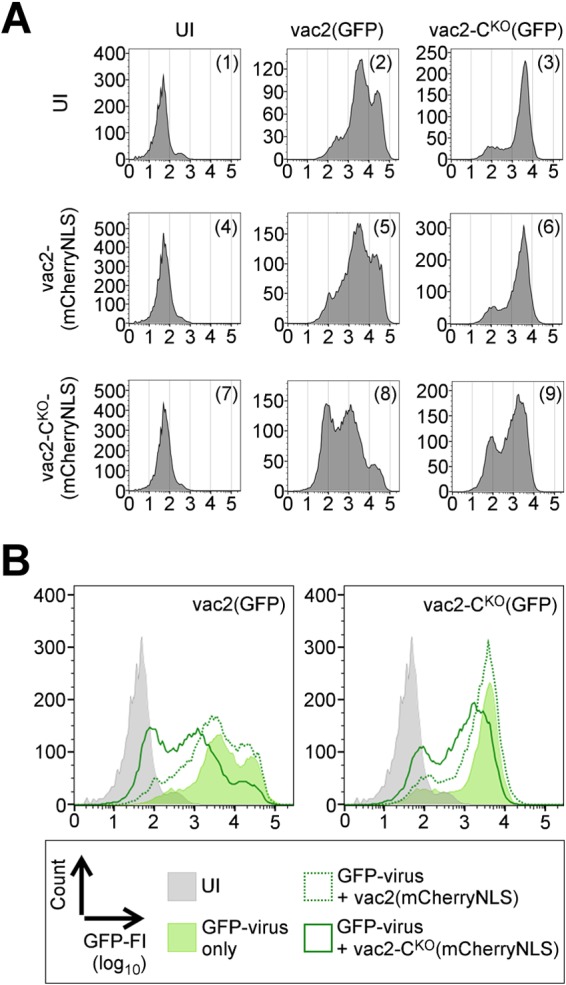
Dominance of the CKO phenotype. (A) GFP fluorescence intensities of cells coinfected with viruses indicated on the top and on the left. UI, uninfected cells. Vertical axis, cell counts (linear scale); horizontal axis, GFP fluorescence intensity (FI; log10 scale). (B) Overlay of graphs from panel A. (Left) Summary of coinfections with vac2(GFP); (right) summary of coinfections with vac2-CKO(GFP). Gray area, uninfected cells (panel 1); light green area, single GFP-virus infection (panel 2 or 3); dotted green line, GFP-virus coinfected with vac2(mCherryNLS) (panel 5 or 6); solid green line, GFP-virus coinfected with vac2-CKO(mCherryNLS) (panel 8 or 9).
