FIG 4.
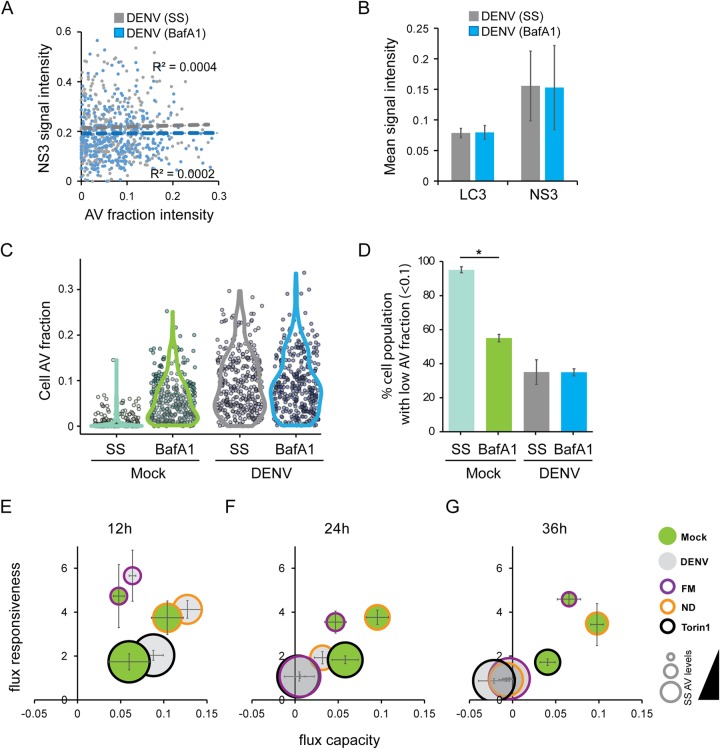
Time-dependent influence of DENV infection on autophagic flux. (A) No correlation between NS3 and AV levels. Huh7 GFP-LC3 cells were infected with DENV (NGC isolate, MOI = 5) or mock inoculated. After 30 h, cells were either treated with DMSO control or 100 nM BafA1 for 6 h, followed by an immunostain against NS3 and ImageStream analysis. NS3 and normalized AV fraction intensities were plotted, and the intensities were tested for correlation. (B) Population mean AV fractions and NS3 signal intensities (scaled to 1) from three independent experiments, as described in panel A. (C) AV fraction shifts in cell populations. The experimental setup is as described for panel A. Population steady-state and BafA1-mediated cumulative AV fraction intensities at 36 h of mock or DENV infection are shown. Dots represent single cells, and the colored shape indicates the distribution of the population. (D) No shift of AV fraction in DENV-infected cells with high shift potential. The percentages of cells with a low AV fraction (<0.1) that respond to BafA1 treatment as described for panel C were determined. (E to G) Kinetics of autophagic flux during DENV infection. Time course population analysis of AV levels in mock-treated cells (steady-state, SS) and in cells treated with BafA1. Huh7 GFP-LC3 cells were infected with DENV NGC (MOI = 5) or mock treated for 12, 24, and 36 h. AT 6 h before harvesting, the cells were subjected to nutrient deprivation (ND), Torin1 (2.5 μM), or full medium (FM) conditions in the presence or absence of 100 nM BafA1. Bubble plots represent the calculated flux metrics, as described in the legend to Fig. 1B. The size of the bubble represents the steady-state AV levels (cells in the absence of BafA1). The data shown here represent the averages of three independent experiments.

