FIG 8.
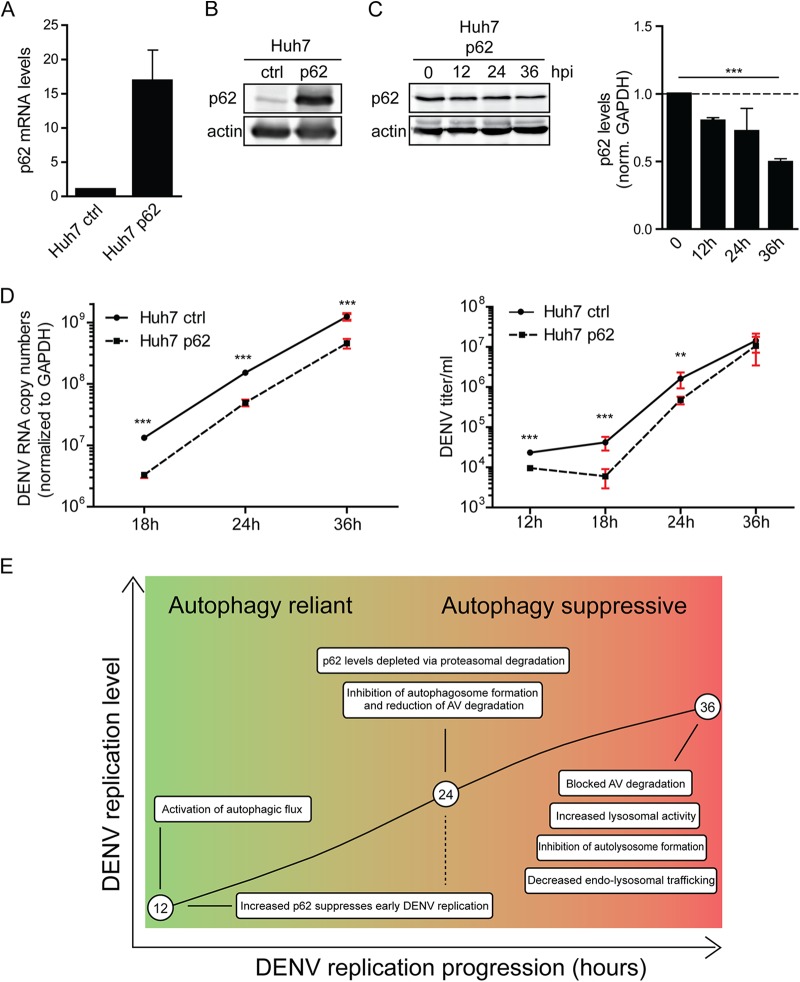
p62 suppresses DENV replication. (A) Quantification of p62 mRNA overexpression. Huh7 cells stably overexpressing p62 or an empty vector control (ctrl) were generated by lentiviral transduction. p62 mRNA levels were quantified by RT-qPCR and normalized to GAPDH. (B) Quantification of p62 protein overexpression. A total of 40 μg of total cell protein was subjected to SDS-PAGE and Western blotting with p62- and β-actin-specific antibodies. (C) Degradation of overexpressed p62 in DENV-infected cells. Huh7 cells overexpressing p62 were infected with DENV NGC (MOI = 5) for the indicated periods, and lysates were analyzed by Western blotting for p62 and β-actin. The signal intensities were quantified by using Intas quantification software to determine the relative levels of p62 and β-actin. Error bars represent the SD of three independent experiments. (D) DENV RNA replication and virus production in p62-overexpressing cells. Huh7 cells overexpressing p62 or an empty vector control (ctrl) were infected with DENV NGC (MOI = 0.25) for the indicated periods. RNA was extracted and analyzed by RT-qPCR (left panel). Virus contained in cell culture supernatant was quantified by plaque assay on Vero cells (right panel). Error bars represent the SD of three independent experiments. The level of significance is denoted by asterisks (***, P ≤ 0.001). (E) Model for the differential impact of DENV on autophagic flux in the course of infection. For further details, see the text.

