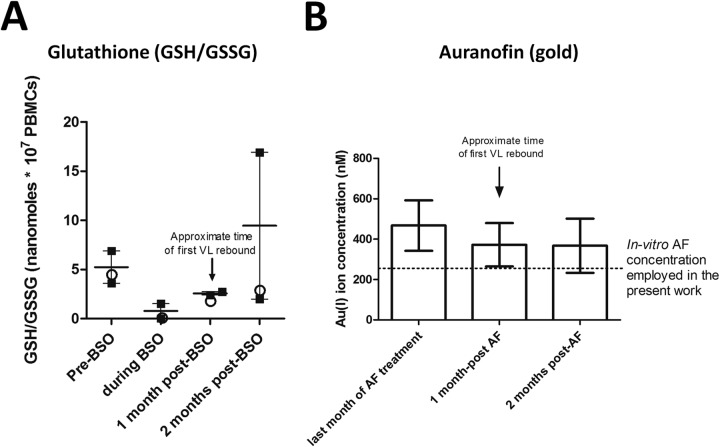
FIG 4.
In vivo levels of glutathione and gold before, during, and after treatment with auranofin and BSO. (A) Concentration of total glutathione (i.e., GSH/GSSG, the molecule[s] depleted by BSO) in PBMCs of the two macaques (4890 and P157) that received auranofin and BSO (squares) and in the macaque (P252) that received BSO separately from auranofin (circles). The arrow shows the approximate timing of viral rebound following therapy suspension. Data are expressed as means ± SEM (calculated from the values from the macaques that received auranofin and BSO [squares]). (B) Concentration of gold (i.e., the active principle of auranofin) in the plasma of four treated macaques. The dotted line shows the concentration of auranofin employed in the in vitro experiments described in this article. Data are expressed as means ± SEM. For details about dosages and schedule of administration of auranofin and BSO see Fig. 1, Table 1 and reference 11.

