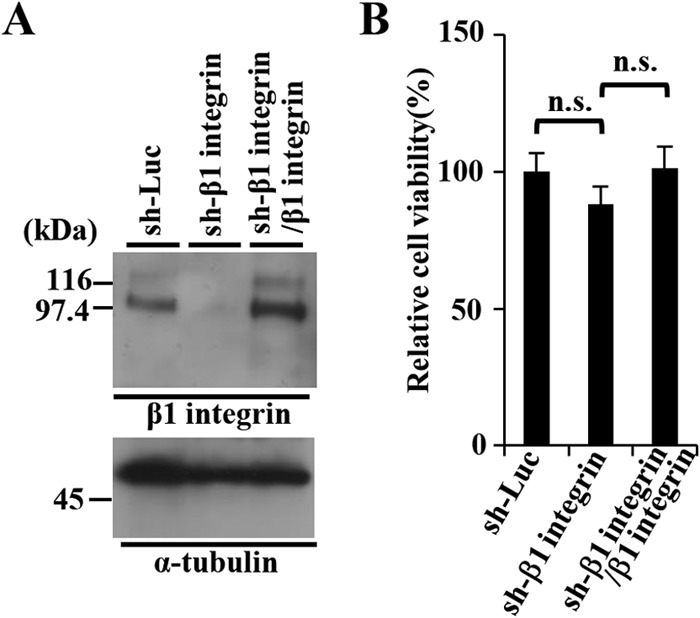
FIG 9.

Characterization of sh-Luc-HEp-2, sh-β1 integrin-HEp-2, and sh-β1 integrin/β1 integrin-HEp-2 cells. (A) Expression of β1 integrin in sh-Luc-HEp-2, sh-β1 integrin-HEp-2, and sh-β1 integrin/β1 integrin-HEp-2 cells was analyzed by immunoblotting with anti-β1 integrin (top) and anti-α-tubulin (bottom) antibodies. Molecular mass markers (in kilodaltons) are shown on the left. (B) Cell viability of sh-Luc-HEp-2, sh-β1 integrin-HEp-2, and sh-β1 integrin/β1 integrin-HEp-2 cells assayed 24 h after 2 × 10⁴ cells were seeded on 96-well plates. Each value is the mean ± the standard error of the results of three independent triplicate experiments and is expressed relative to the mean for sh-Luc-HEp-2 cells, which was normalized to 100%. Statistical analysis was performed by one-way ANOVA and Tukey's test. n.s., not statistically significant.
