FIG 3.
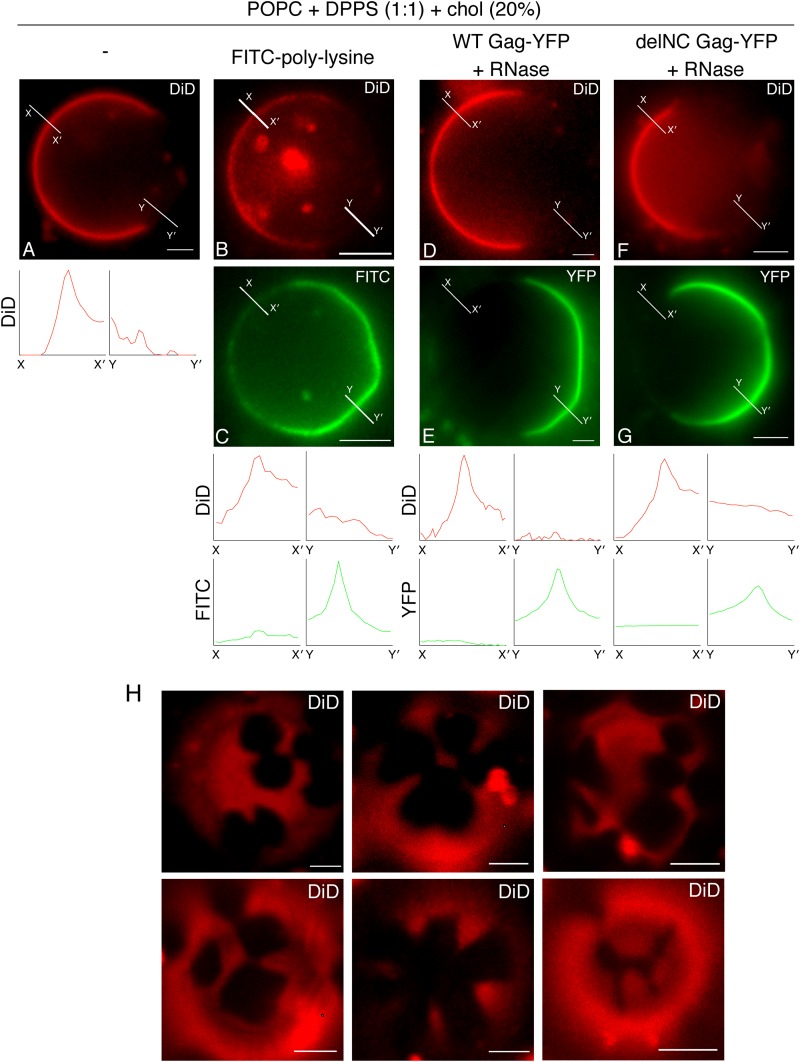
In the absence of PI(4,5)P2, Gag binds to the DPPS-enriched DiD(−) phase after RNase treatment. (A) An example of an epifluorescence image of POPC+DPPS+chol+DiD GUVs containing DiD(+) and DiD(−) phases. (C) Binding of FITC-polylysine to POPC+DPPS+chol GUVs. (E and G) Binding of either WT Gag-YFP (E) or delNC Gag-YFP (G) to POPC+DPPS+chol GUVs was examined after RNase treatment. (B, D, and F) Corresponding images of DiD. The lipid ratio used was as follows: POPC:DPPS:chol, 40:40:20. Representative images from at least 3 independent experiments are shown. Fluorescence intensity profiles of DiD (red) and FITC or YFP (green) along the short lines drawn to cross over DiD(+) (X to X′) and DiD(−) (Y to Y′) regions of GUVs are shown below the images. (H) Six examples of confocal images of the top surface of POPC+DPPS+chol GUVs (POPC:DPPS:chol, 40:40:20) containing DiD are shown. Note that these two-phase GUVs displayed irregularly shaped DiD(−) phases. Bar, 5 μm.

