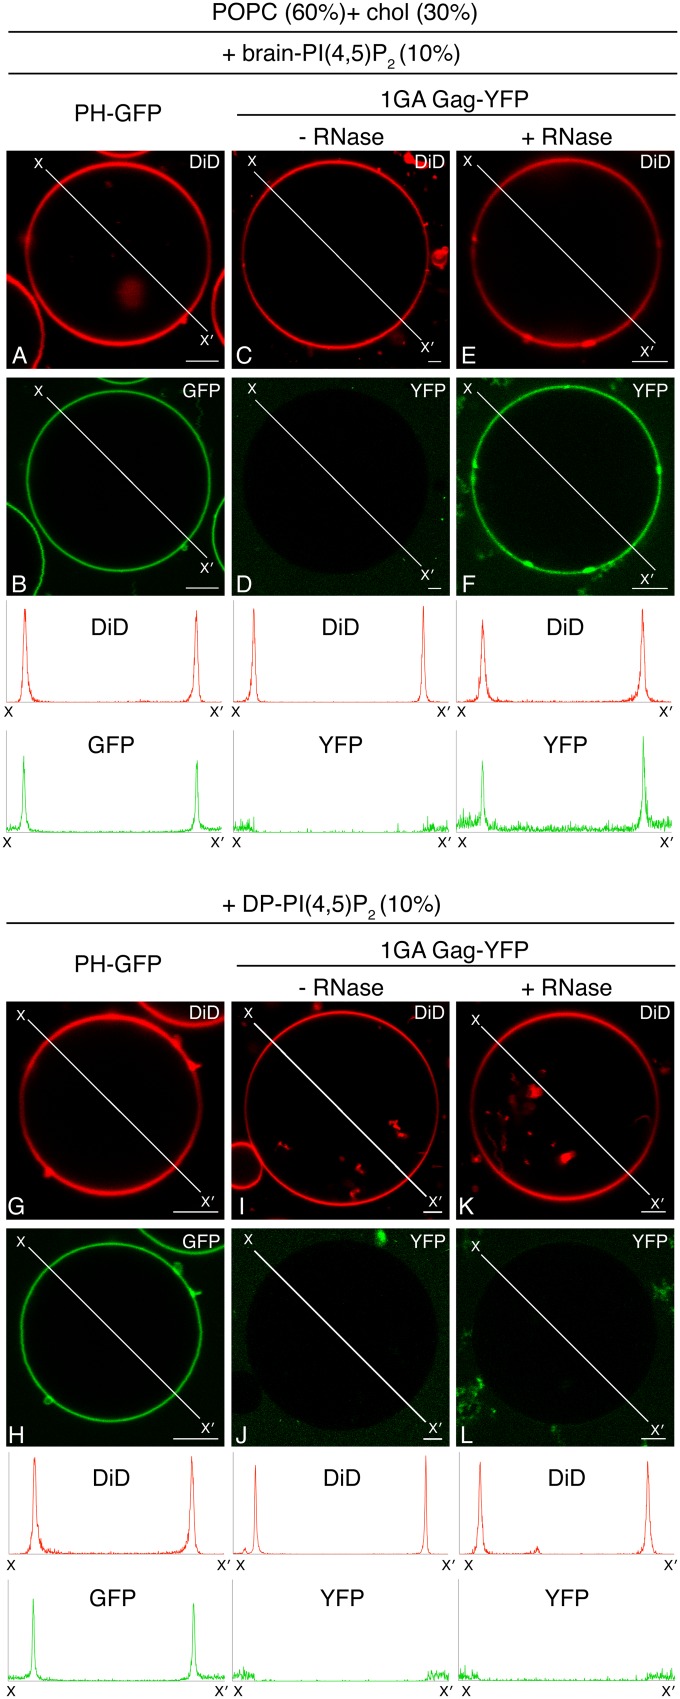
FIG 6.
RNase-treated 1GA Gag-YFP binds to GUVs containing brain-PI(4,5)P2 but not DP-PI(4,5)P2 as a sole acidic lipid. Binding of PH-GFP (B and H), 1GA Gag-YFP (D and J), and RNase-treated 1GA Gag-YFP (F and L) to either POPC+chol+brain-PI(4,5)P2 (B, D, and F) or POPC+chol+DP-PI(4,5)P2 (H, J, and L) GUVs were examined using confocal microscopy. PH-GFP and 1GA Gag-YFP were imaged using the same microscopy settings. Corresponding images of DiD are shown in panels A, C, E, G, I, and K. Representative images from at least 3 independent experiments are shown. Fluorescence intensity profiles of DiD (red) and PH-GFP or Gag-YFP (green) along the lines drawn to cross over opposite sides of GUVs (X to X′) are shown below. The intensity profiles for PH-GFP and Gag-YFP are shown on the same y axis scale. The lipid ratio used was as follows: POPC:chol:PI(4,5)P2, 60:30:10. Bar, 5 μm.

