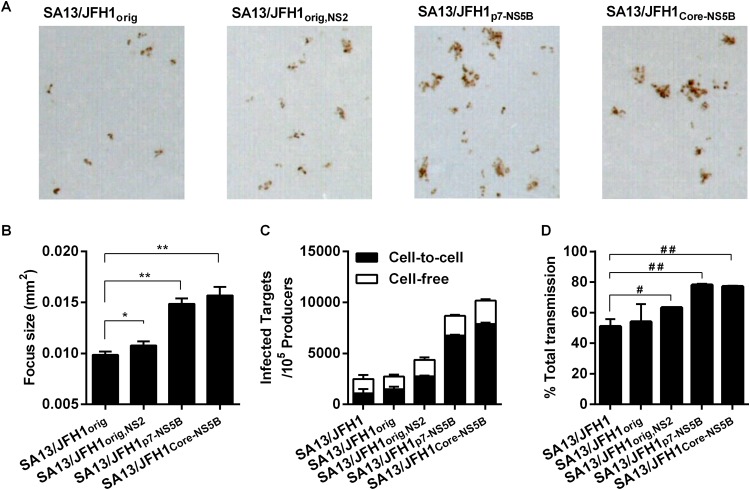
FIG 4.
Adaptive mutations enhance cell-to-cell transmission. (A) Representative images of individual foci generated by the indicated viruses. Images were generated using BioSpot 5.0 software for the Immunospot series 5 UV analyzer (CTL Europe GmbH). (B) Individual focus sizes (square millimeters) generated by infection of Huh7.5 cells with the indicated viruses were determined automatically at the peak of infection as described in Materials and Methods. Focus size is shown as the mean of the sizes of all foci in three replicate wells with SEM. The Mann-Whitney test was performed to determine P values as described in Materials and Methods. *, P = 0.0001; **, P < 0.0001. (C and D) Huh7.5 cells were transfected with HCV RNA transcripts, labeled with CMFDA, and cocultured with naive Huh7.5 target cells in the presence or absence of anti-HCV Ig as described in Materials and Methods. (C) The number of newly infected target cells per 105 infected producer cells is presented, where the frequencies of cell-free transmission (white) and cell-to-cell (black) transmission events are shown. (D) Percentage of total transmission events occurring by cell-to-cell transmission. Bars represent the means from two replicate experiments with standard deviations. The unpaired t test was performed to determine P values. #, P < 0.05; ##, P < 0.0001. For panels C and D, data for SA13/JFH1orig were generated in a separate experiment.

